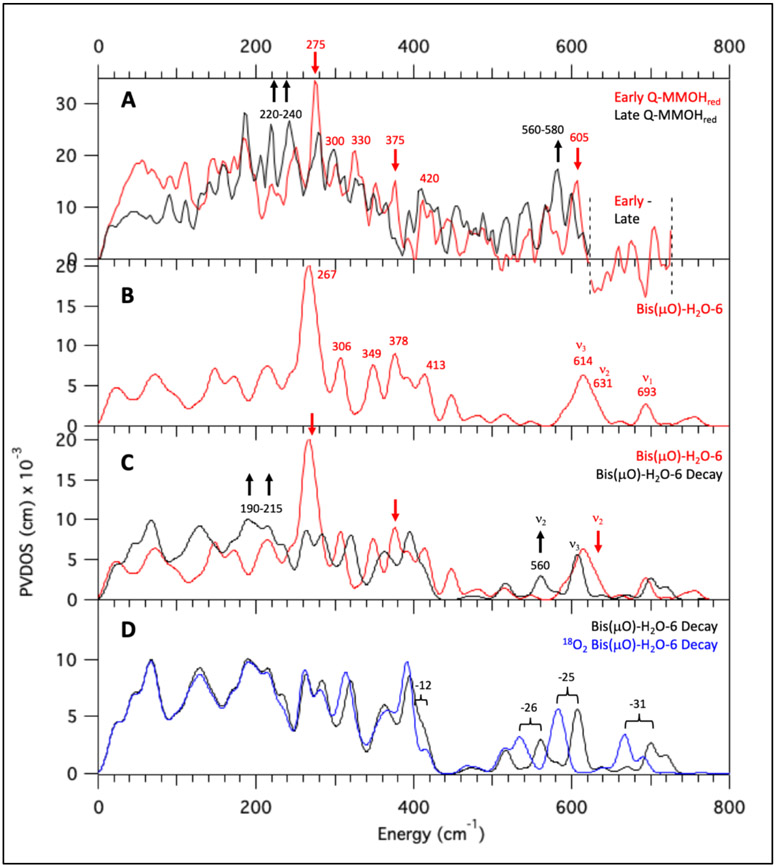
Figure 8.
Calculated NRVS spectra of bis(μO)-H2O-6 as representative of bis(μO) and bis(μO)-H2O subclasses. All spectra simulated with B3LYP. (A) Early Q – MMOHred (red) and Decayed Q – MMOHred (black) NRVS data. Arrows indicate major spectral differences. (B) Calculated NRVS spectrum of bis(μO)-H2O-6. (C) Calculated NRVS spectra bis(μO)-H2O-6 (red) and its simulated decay product bis(μO)-H2O-6 Decay (black). Arrows indicate major spectral differences. (D) Calculated NRVS spectra for bis(μO)-H2O-6 Decay (black) and its 18O2 isotopomer (blue).

