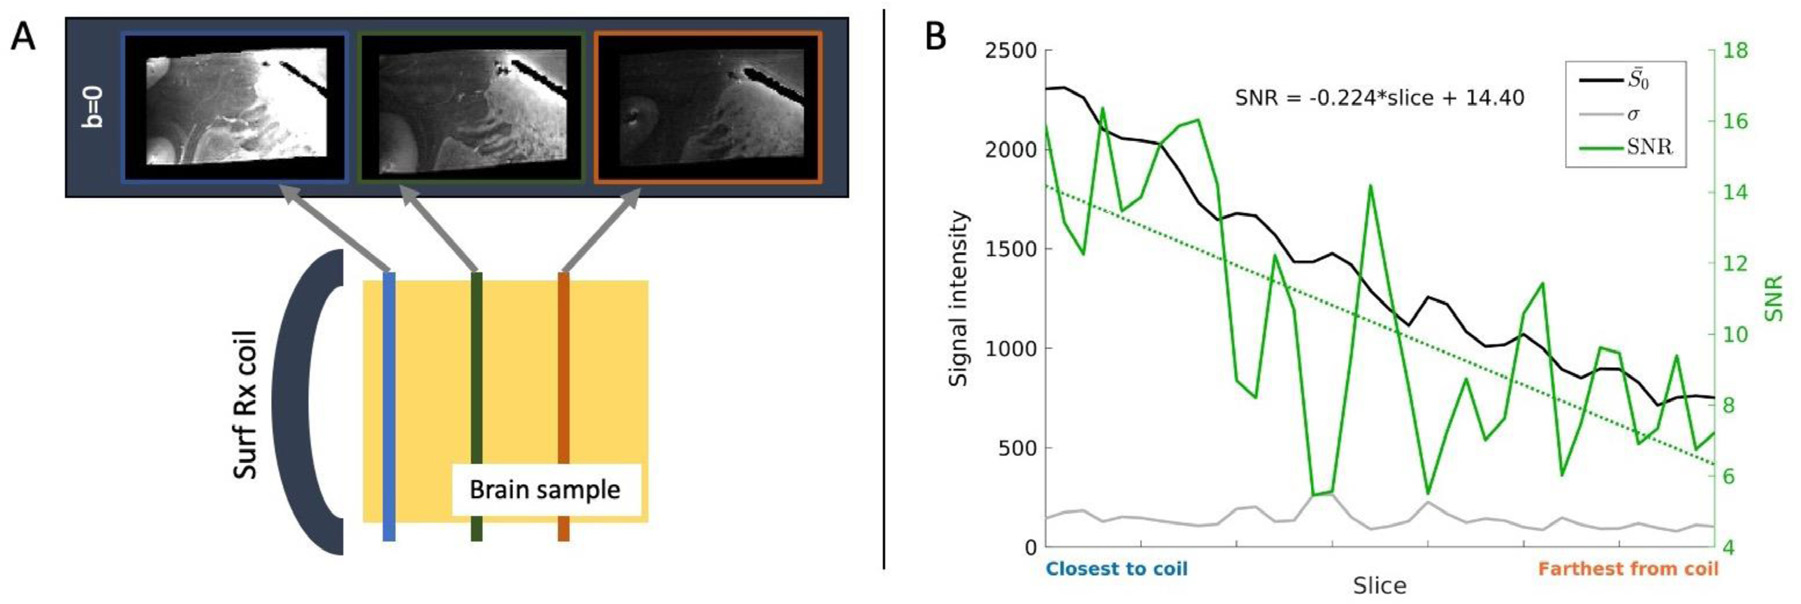
Fig. 2.

dMRI acquisition and SNR. (A) Bottom: A surface receive coil was used in dMRI acquisitions. Top: This led to a decrease in sensitivity with increasing distance from the coil, as shown in coronal slices from the sample 1A b=0 volume. The same intensity scaling was used for all three slices. (B) The b=0 SNR in each coronal slice of sample 1A (solid green line) was calculated from the mean (black line) and standard deviation (gray line) of signal intensities from a deep WM ROI. A linear regression was performed to find the slope of SNR as a function of slice (dotted green line). The left y-axis shows the signal and noise intensities, and the right y-axis shows SNR values. The x-axis in indexed by slice number.
