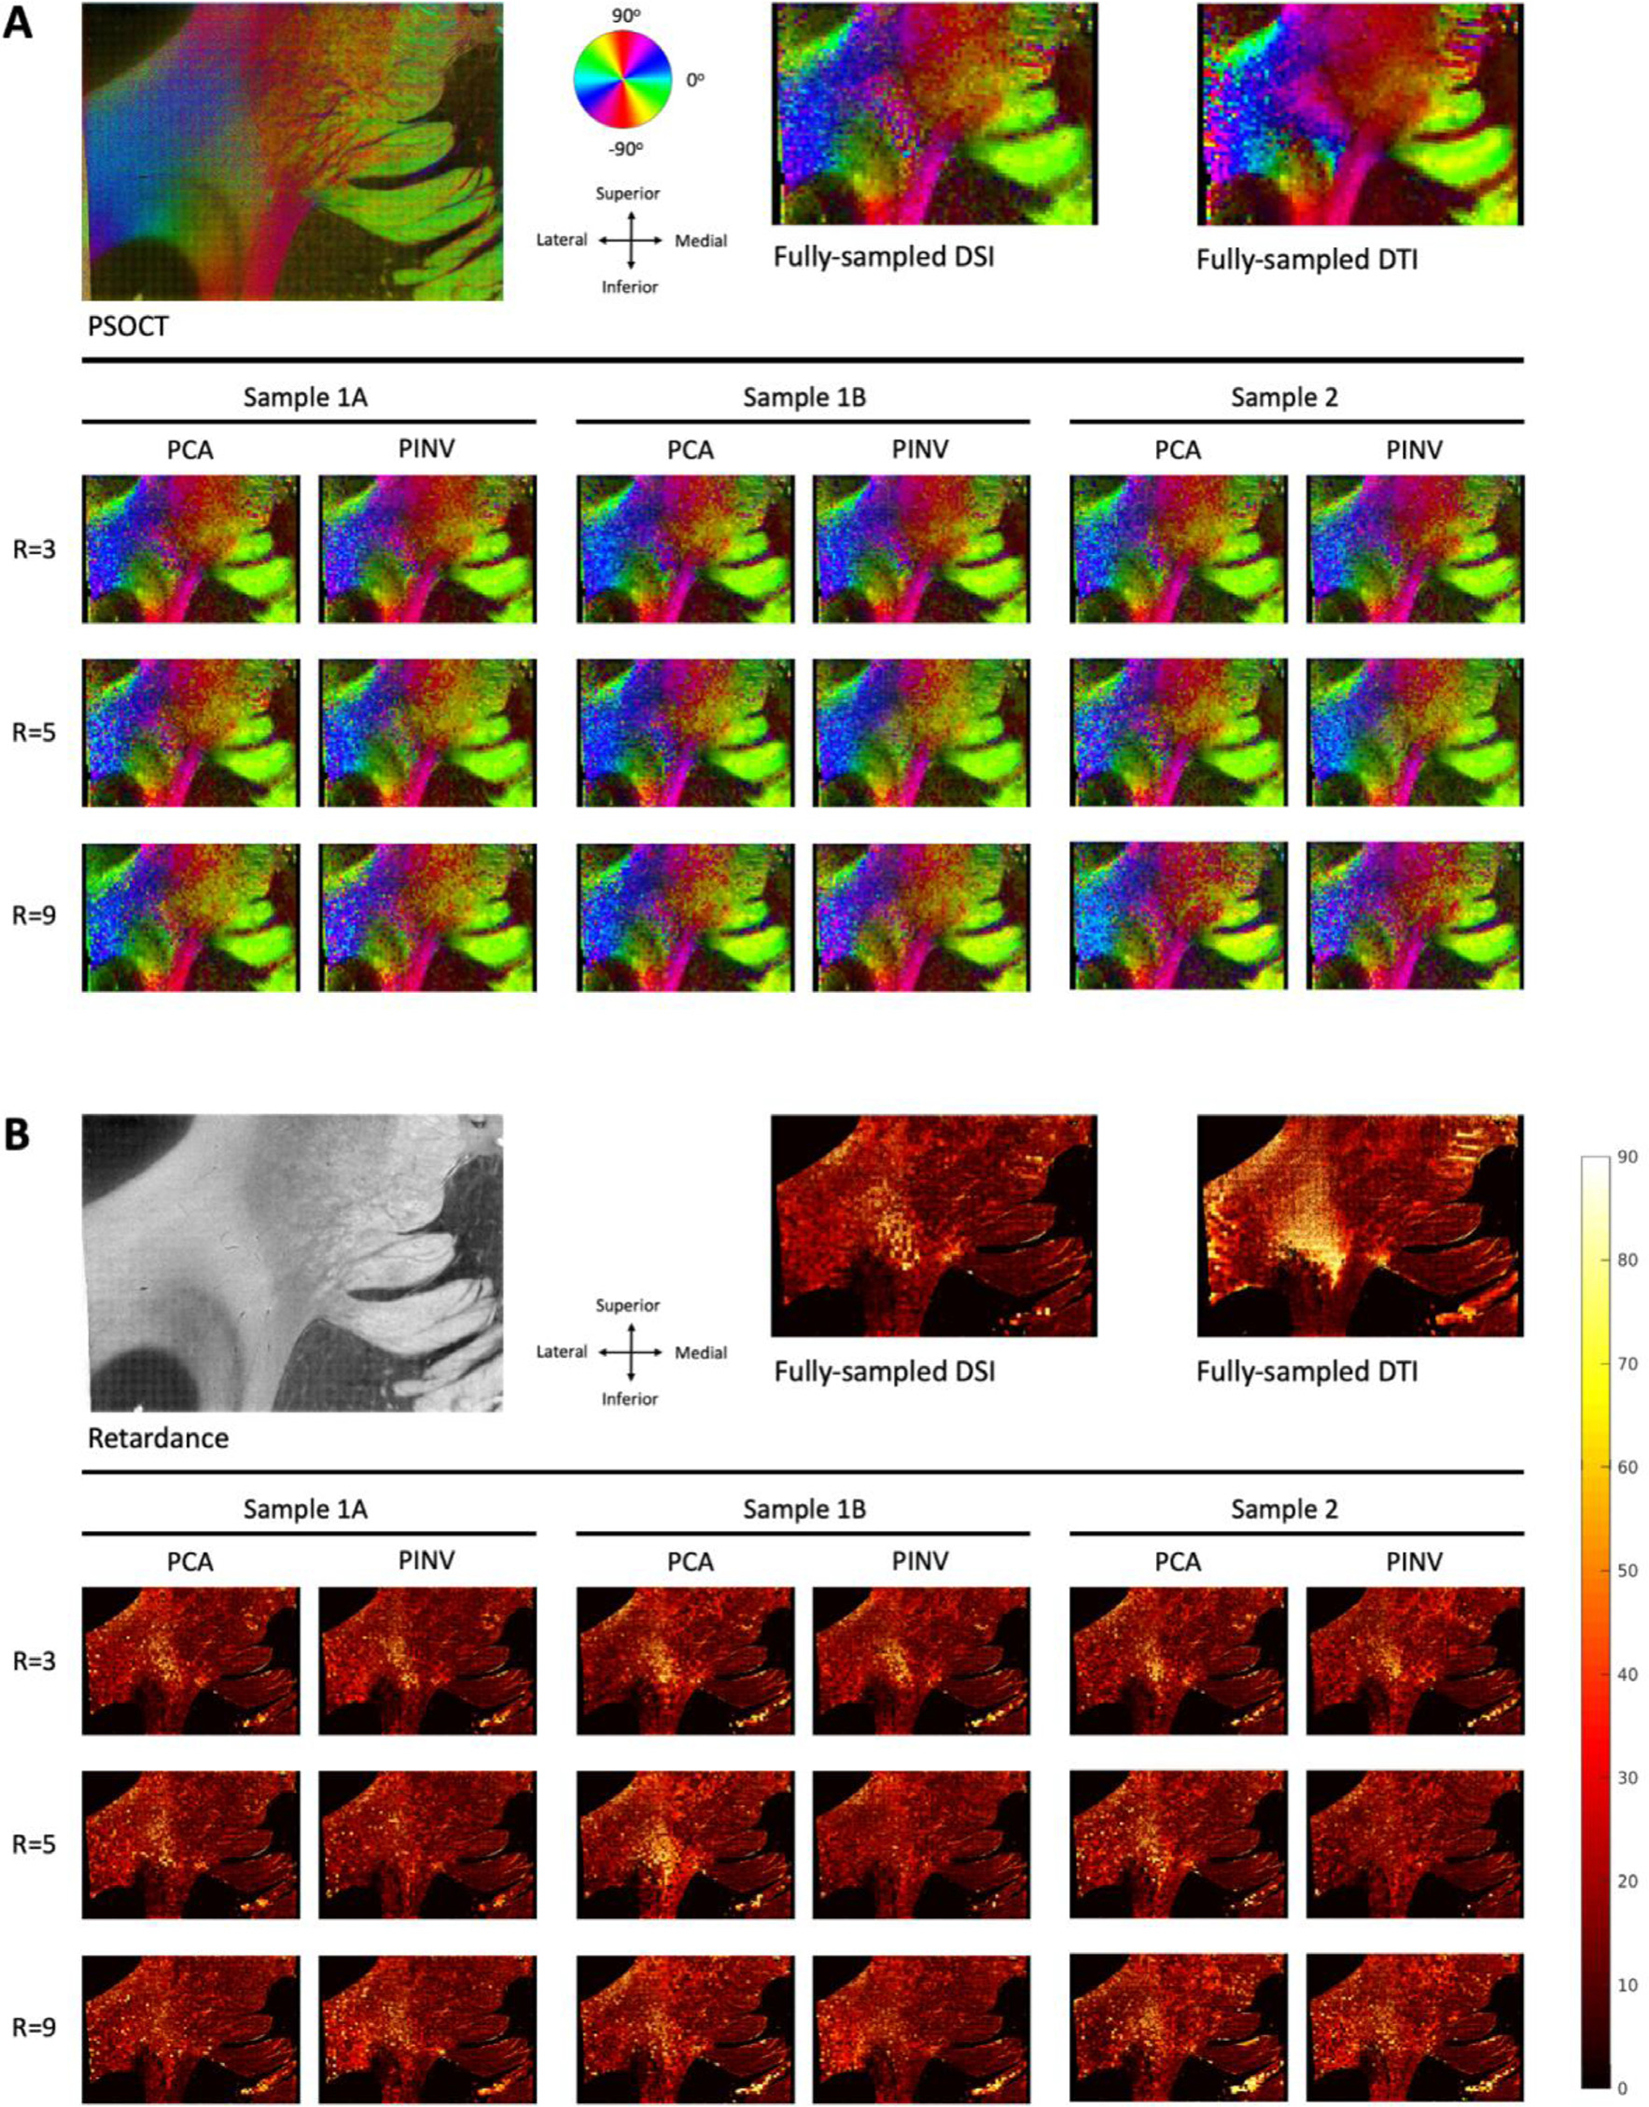
Fig. 3.

Fiber orientations estimated from dMRI vs. PSOCT. (A) Color-coded maps of PSOCT (top left) and dMRI orientations from fully sampled data (top right) and CS-DSI data (bottom). (B) Absolute angular error of dMRI orientations with respect to PSOCT. A WM mask was created by thresholding the PSOCT retardance (top left). The heat maps were masked to include only voxels classified as WM. CS-DSI reconstructions are shown for high-SNR training data and one of the CS undersampling masks.
