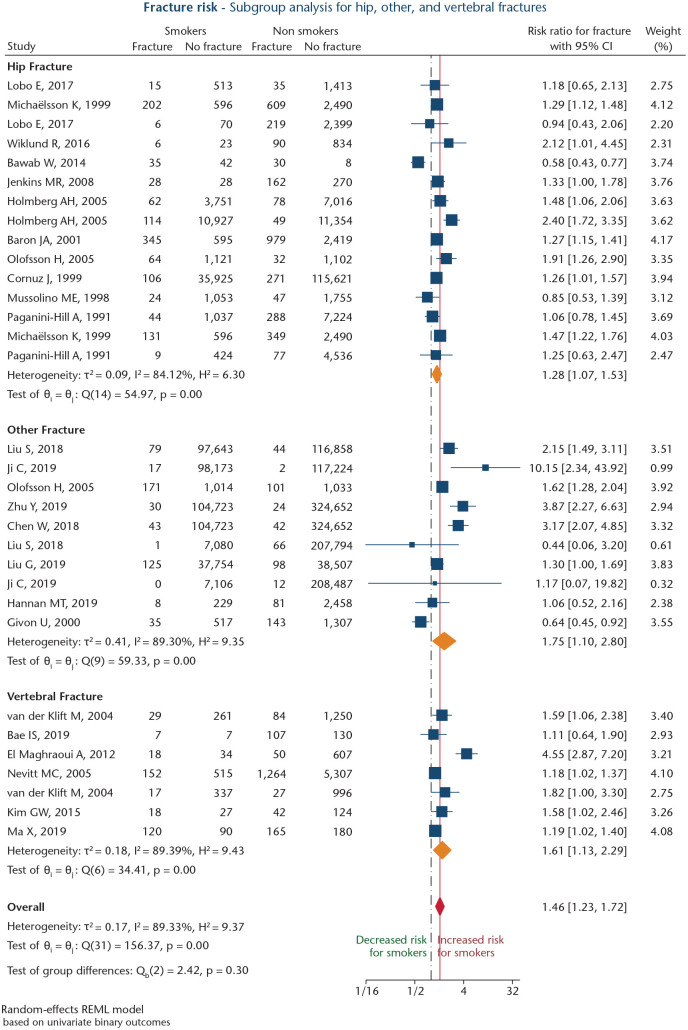
Fig. 2.
Forest plot of studies analysing risk of smoking on fracture incidence, divided into hip fractures, vertebral fractures, and other fracture sites. Orange diamonds depict effect sizes for subgroups, and the red diamond shows overall effect size. The dashed black line depicts the no-effects line. The solid red line marks overall effect size value.

