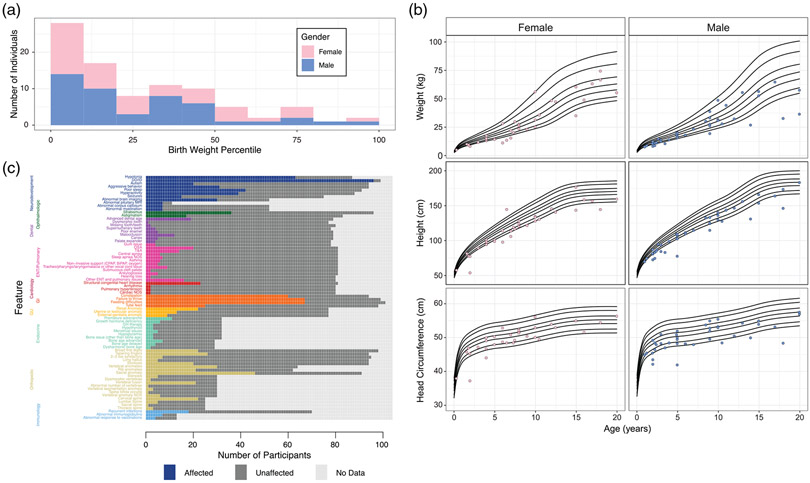
FIGURE 3.
Clinical features of participants, including growth parameter analysis. (a). Birth weight. the reported birth weight percentile is presented with the fill color of the histogram bar indicating the gender of the participant. (b) Growth parameters over time by gender. Each point indicates a participant's growth parameter at the most recent examination. Participants older than 20 years of age at the most recent evaluation were excluded. the black lines indicate in each panel indicate the 1st, 5th, 25th, 50th, 75th, 95th, and 99th percentiles. (c) Clinical features. Each box denotes a single participant. The colored boxes denote affected, the dark gray boxes denote unaffected, the light gray boxes indicate data not available. For quantification, see Table S5

