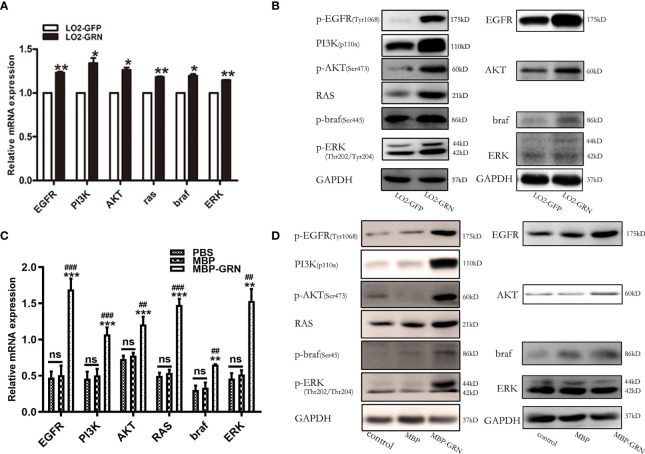
Figure 6.
Detection of signaling pathway markers in CsGRN overexpression cells. (A, B) The mRNA and protein levels of RAS/MAPK/ERK and PI3K/Akt signaling pathways were detected in CsGRN-overexpressed LO2 cells. * P < 0.05 versus control group, ** P < 0.01 versus control group. (B, D) The mRNA and protein levels of RAS/MAPK/ERK and PI3K/Akt signaling pathways were explored in recombinant CsGRN protein–treated LO2 cells. ** P < 0.01 versus PBS group, *** P < 0.001 versus PBS group. ## P < 0.01 versus MBP group, ### P < 0.001 versus MBP group. The relative mRNA levels of the target genes were determined by q-PCR. The protein expression was determined by Western blot, and the quantification of protein expression was measured by Image J software. Three independent experiments were conducted.

