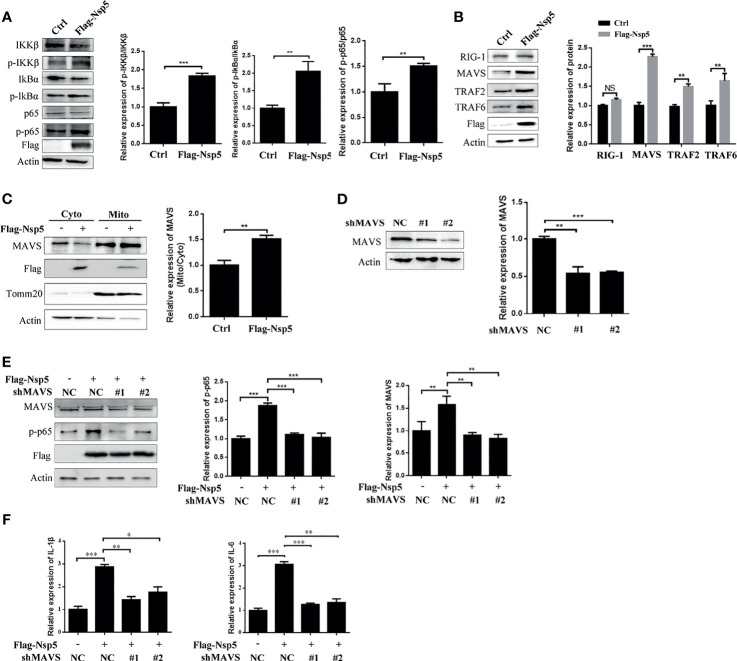
Figure 3.
SARS-CoV-2 Nsp5 promotes IL-1β expression through targeting MAVS. (A, B) Calu-3 cells were transfected with Flag-Nsp5 or empty vector for 36 h, and protein levels were analyzed by western blot. The relative expression levels of p-IKKβ/IKKβ, p-IkBα/IkBα and p-p65/p65 (A) and relative expression levels of proteins to Actin (B) were estimated by densitometry calculation. (C) Calu-3 cells transfected with Flag-Nsp5 or empty vector for 36 h. Then, cytosol and mitochondrial fractions of transfected cells were prepared, the levels of MAVS protein, Flag-Nsp5, Tomm20 (loading control of mitochondria) and Actin (loading control of cytoplasm) were analyzed by western blot. The relative expression levels of MAVS in mitochondria to MAVS in cytoplasm were estimated by densitometry calculation. (D) Calu-3 cells were transfected with MAVS-shRNAs or negative control for 36 h. The levels of mRNA and protein of MAVS were analyzed by qRT-PCR or western blot, respectively. The relative expression levels of MAVS to Actin were estimated by densitometry calculation. (E, F) Calu-3 cells were co-transfected with MAVS-shRNAs or negative control with Flag-Nsp5 or empty vector for 36 h, the levels of MAVS, p-p65, Flag-Nsp5, and Actin (loading control) were analyzed by western blot and relative expression levels of MAVS and p-p65 to Actin were estimated by densitometry calculation (E). mRNA levels of IL-Iβ and IL-6 were analyzed by qRT-PCR (F). Data were presented as Mean ± SEM for three biological replicates, and statistical significance was calculated by one-way ANOVA, *P < 0.05, **P < 0.01, ***P < 0.001, NS, not significant.

