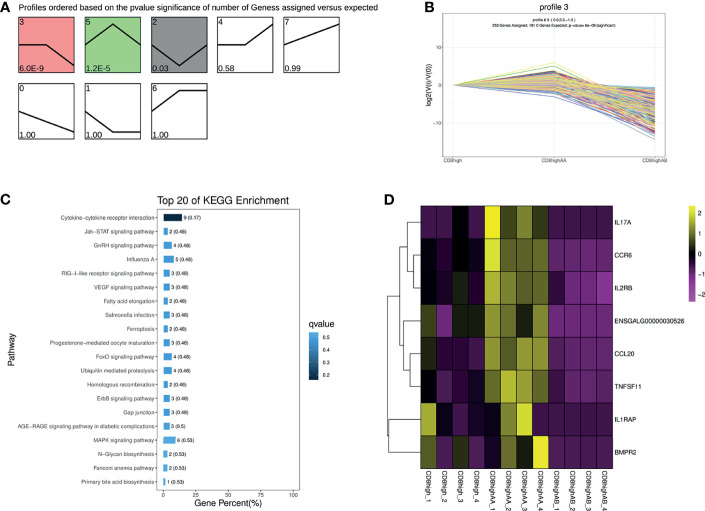
Figure 2.
Trend analysis of CD8high+, CD8high αα+, and CD8high αβ+ T cells. (A) All differentially expressed gene (DEG) expression profiles ordered based on the p values in the order of CD8high+ T cells (containing CD8high αα+ and CD8high αβ+ T cells), CD8high αα+ T cells and CD8high αβ+ T cells. (B) The DEG expression trends in profile 3. (C) Top 20 KEGG pathways were selected for profile 3 DEGs enrichment. (D) Heat map of DEGs expression enriched in the “Cytokine–cytokine receptor interaction” pathway.

