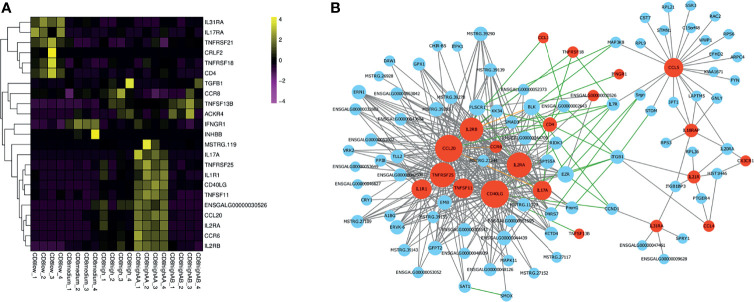
Figure 4.
Gene expression analysis enriched in the “Cytokine–cytokine receptor interaction” pathway of CD4+CD8low+, CD8medium+, CD8high+, CD8high αα+,and CD8high αβ+ T cell populations. (A) Heat map of selected immune genes enriched in the “Cytokine–cytokine receptor interaction” pathway. (B) Gene interaction network analysis based on WGCNA analysis and STRING database. The gray line indicates the potential interaction relationship based on the WGCNA analysis. The green line indicates the potential interaction relationship based on the STRING database. The pink line indicates the potential interaction based on both the WGCNA analysis and STRING database. Red nodes represent hub genes.

