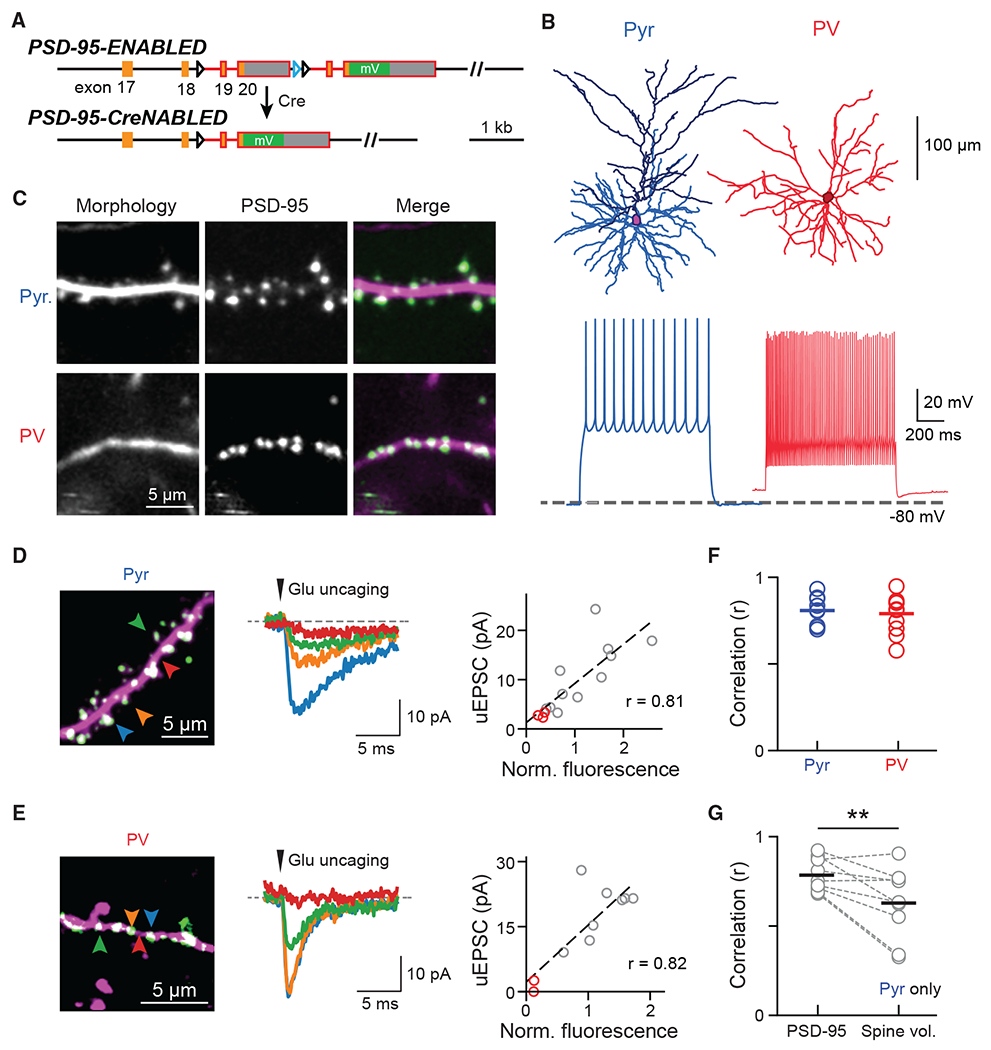
Figure 1. Visualizing endogenous PSD-95 as a proxy for the presence and weight of excitatory synapses onto Pyr and PV+ dendrites.

(A) Schematic of the ENABLED/CreNABLED strategy for tagging endogenous PSD-95 with mVenus in a Cre-dependent manner.
(B) Representative cellular reconstructions (top) and spike trains (bottom) elicited via supra-threshold current steps from Pyr (left) and PV+ (right) neurons.
(C) Representative two-photon images of dendritic segments from Pyr neurons (top) and PV+ interneurons (bottom). PSD-95 (green) and dendritic morphology (magenta) were labeled simultaneously.
(D and E) Two-photon glutamate uncaging experiment for Pyr (D) and PV+ (E) neurons in acute brain slices. Left: representative images; colored arrowheads correspond to the traces shown. Middle: Example uEPSCs (average of 5–10 trials). Right: correlation between integrated PSD-95mVenus fluorescence intensities with uEPSC of the example dendrite. Red circles indicate stimulations at locations without PSD-95mVenus.
(F) Correlation (Pearson’s r) between PSD-95mVenus fluorescence and uEPSC amplitude within individual dendrites. Averages are: 0.81 ± 0.03, n (dendrites/cells/animals) = 9/6/3 for Pyr neurons; and 0.79 ± 0.03, n = 11/8/3 for PV+ neurons.
(G) Correlation between uEPSC amplitudes and PSD-95mVenus fluorescence versus spine volume in Pyr neurons. Only clear, laterally protruding spines were included. Averages are 0.78 ± 0.03 for PSD-95mVenus and 0.63 ± 0.07 for spine volume, n (dendrites/animals) = 9/3. One-sided Wilcoxon signed-rank test: p = 0.009, W = 42.
See also Figure S1.
