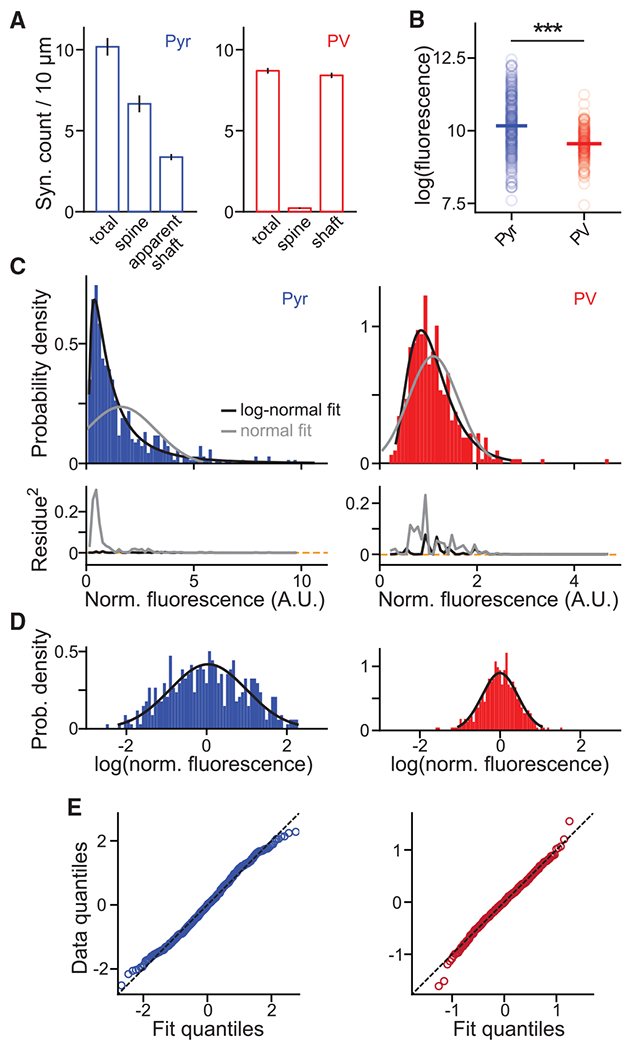
Figure 2. Population characteristics of the organization of synapses and their weights.

(A) The density of PSD-95mVenus puncta, and the fractions on laterally protruding spines and of those colocalized with dendritic shafts on Pyr (left) and PV+ (right) dendrites in vivo.
(B) Absolute integrated PSD-95mVenus fluorescence of Pyr and PV+ synapses in the logarithmic scale. Only synapses between 10 and 50 μm beneath the pia are included. Medians are 10.16 ± 0.05 (SEM), n (synapses/dendrites/animals) = 308/9/4 for Pyr, and 9.6 ± 0.04, n = 191/10/7 for PV+. Wilcoxon rank-sum test: p < 0.001, U = 8.28.
(C) Probability density histograms of normalized synaptic PSD-95mVenus fluorescence fitted by log-normal or normal distributions (top) and their squared residues (bottom). n (synapses/dendrites/animals) = 452/14/4 and 409/21/7 for Pyr and PV+, respectively.
(D and E) Histograms of the logarithm of synaptic PSD-95mVenus fluorescence plotted with the best-fit normal distribution (D) and their quantile-quantile plots (E).
All error bars are SEM. See also Figure S2.
