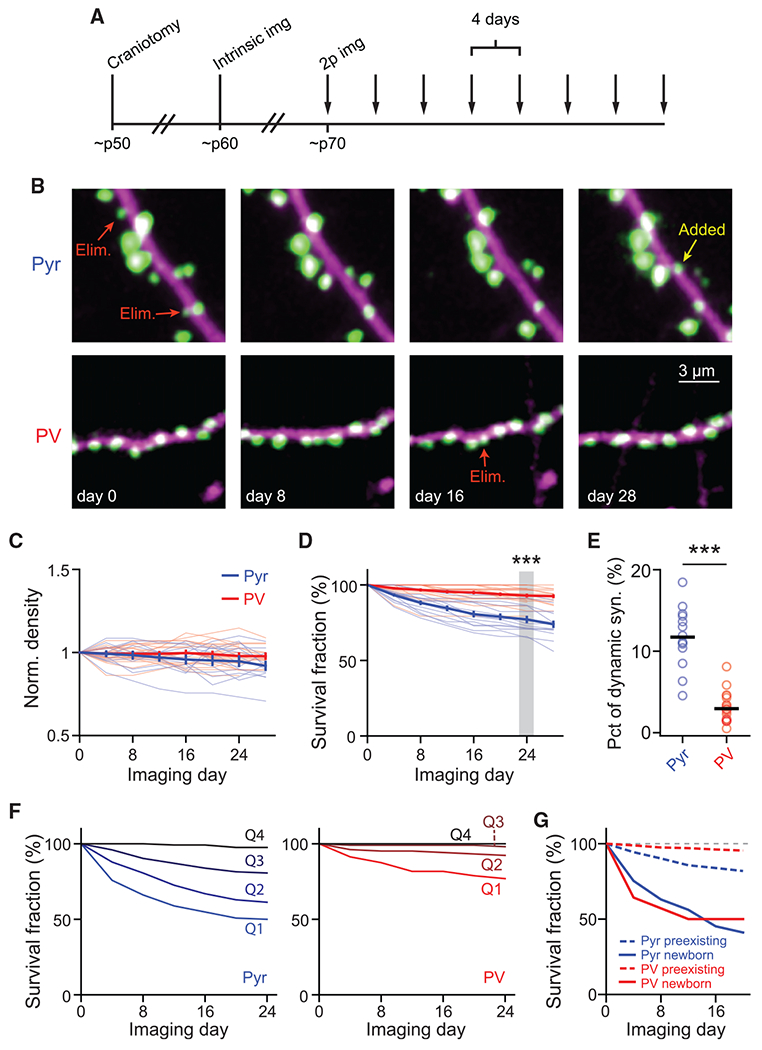
Figure 3. Synapses onto PV+ dendrites are more stable compared to those onto pyramidal dendrites.

(A) Experimental protocol for longitudinal in vivo experiments.
(B) Representative images of Pyr (top) and PV+ (bottom) dendrites in layer 1 imaged over a month. Arrows indicate representative added and eliminated (Elim.) synapses.
(C) Time course of the synaptic density of Pyr and PV+ dendrites normalized to day 0.
(D) Survival fraction of synapses present on the first imaging session at subsequent time points. n (synapses/dendrites/animals) = 594/14/4 for Pyr and 683/21/7 for PV. Wilcoxon rank-sum test: p < 0.001, U = 4.09.
(E) Percentage of synapses on a dendritic segment that were added or eliminated during a 4-day interval. n (dendrites/animals) = 14/4 for Pyr and 21/7 for PV. Wilcoxon rank-sum test: p < 0.001, U = 4.8.
(F) Survival fractions of four quartiles (from weak to strong: Q1–Q4) of synapses sorted by weight on the first imaging day. n = 124 and 104 synapses/quartile for Pyr and PV+ dendrites, respectively.
(G) Survival fractions of newborn versus preexisting synapses onto Pyr and PV+ dendrites. n = 552, 441, 73, and 14, respectively, for Pyr preexisting, PV+ preexisting, Pyr newborn, and PV+ newborn.
All error bars are SEM. See also Figures S2 and S3.
