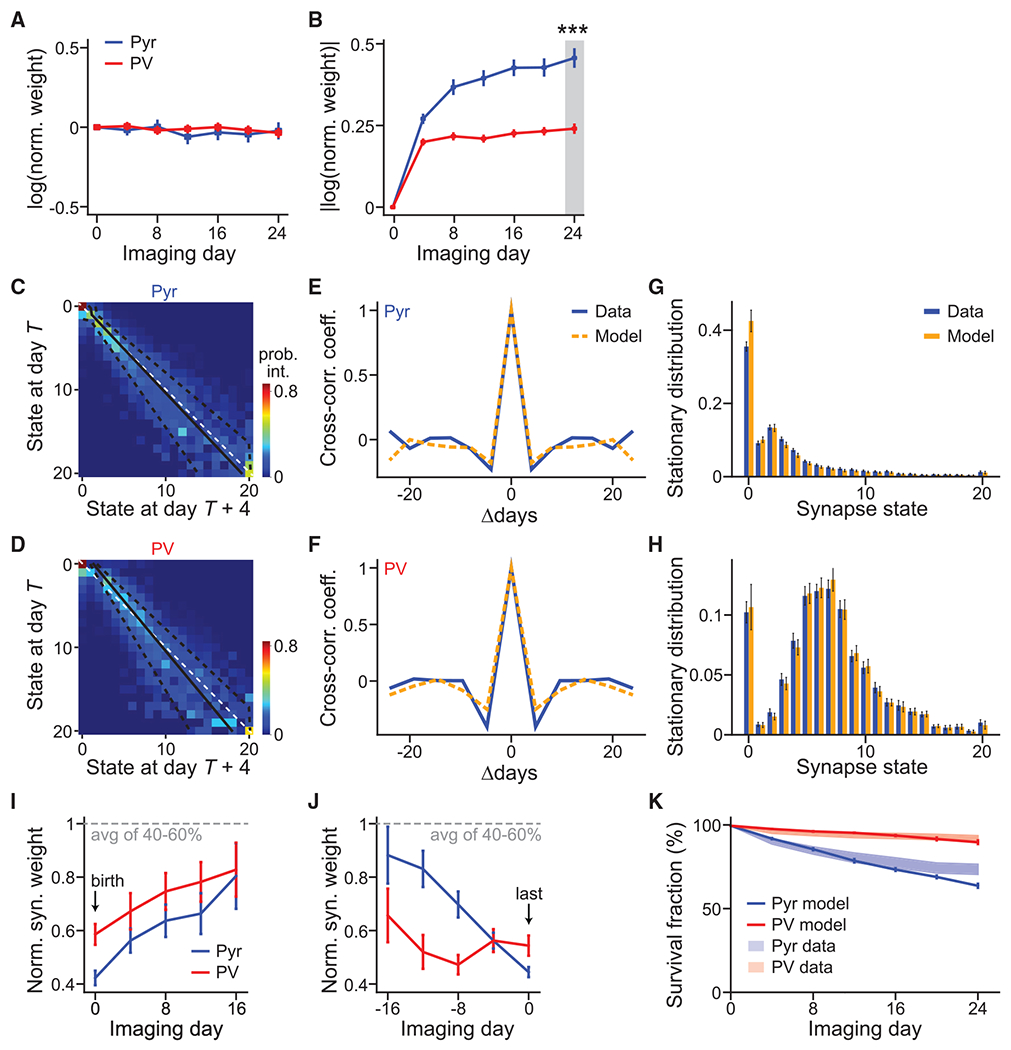
Figure 4. Markov-chain model reveals cell-type-specific principles of synaptic weight dynamics.

(A and B) Average of signed (A) and absolute (B) synaptic weight changes relative to day 1 in the natural log scale. n = 174 for Pyr and 190 for PV+.
(C and D) The Markov-state transition matrices of Pyr (C) and PV+ (D) synapses. The unity line (white dashed) and fitted Kesten process with its ± 1 standard deviation (solid and dashed black lines, respectively) are superimposed. The Markov process was fit using 678 and 451 high-quality synapses for Pyr and PV+ dendrites, respectively.
(E and F) Cross-correlation coefficient between synaptic weight changes from day T to day T+4 and those from day T+Δ to day T+Δ+4, averaged over all synapses and days.
(G and H) Steady-state distributions of synaptic weight for Pyr(G) and PV+ (H), as computed from experimental data (blue) or as predicted by the Markov model (orange). Error bars denote standard deviation across 30 bootstrap runs.
(I and J) Addition-triggered (I) and elimination-triggered (J) averages of weight trajectories, aligned to birth and death, respectively. n (synapses) = 225 (Pyr birth), 271 (PV+ birth), 45 (Pyr death), and 50 (PV+ death).
(K) The survival fraction as a function of time predicted by the Markovian transition model (solid lines) compared with experimental data (shades, SEM; same as Figure 3D) for both Pyr and PV+ synapses. n (synapses) = 721 (Pyr model), 468 (PV+ model), 496 (Pyr data), and 416 (PV+ data).
All error bars are SEM. See also Figures S2 and S4.
