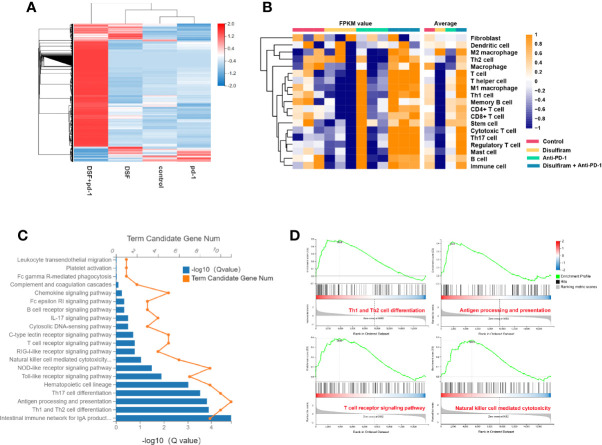
Figure 6.
The modulation of tumor immune microenvironment in the combination of DSF and anti-PD-1 therapy. (A) Heat map shows gene expression profiles of a selected list of the immune microenvironment showing fold changes in the groups of control, DSF, anti-PD-1 antibody, combination. (B) The MCP counter algorithm was utilized to analyze the degree of infiltration of immune cells with mRNA expression in the groups of control, DSF, pd-1, combination. (C) The Gene ontology (GO) and Kyoto Encyclopedia of Genes and Genomes (KEGG) functional enrichment analyses of mRNAs in the groups of control vs DSF. (D) KEGG functional enrichment analysis of the anti-PD-1 blocking antibody groups and the combination of DSF and the anti-PD-1 blocking antibody groups based on GSEA.

