Figure 2.

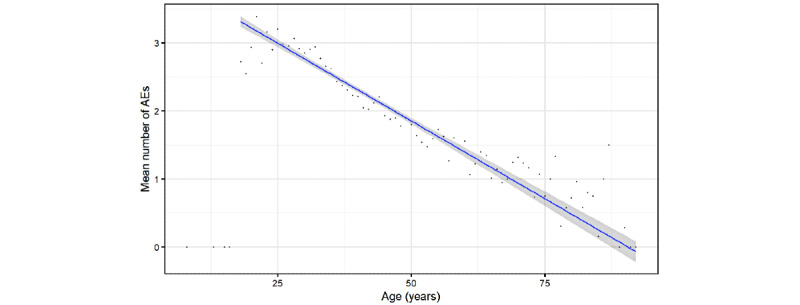
Scatterplot of the number of adverse events (AEs) reported by user vs. age. Dots indicate the mean number of AEs for a given age, while the blue line indicates the linear regression trend and shadowed area indicate its CIs.

Scatterplot of the number of adverse events (AEs) reported by user vs. age. Dots indicate the mean number of AEs for a given age, while the blue line indicates the linear regression trend and shadowed area indicate its CIs.