Figure 3.

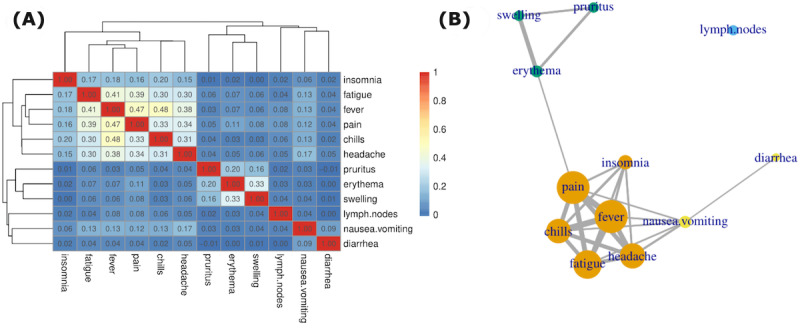
Co-occurrence of adverse events (AEs), shown as (A) hierarchical clustering based on the correlation matrix of AE symptoms and (B) the corresponding network of AE symptoms with different communities denoted by color code.

Co-occurrence of adverse events (AEs), shown as (A) hierarchical clustering based on the correlation matrix of AE symptoms and (B) the corresponding network of AE symptoms with different communities denoted by color code.