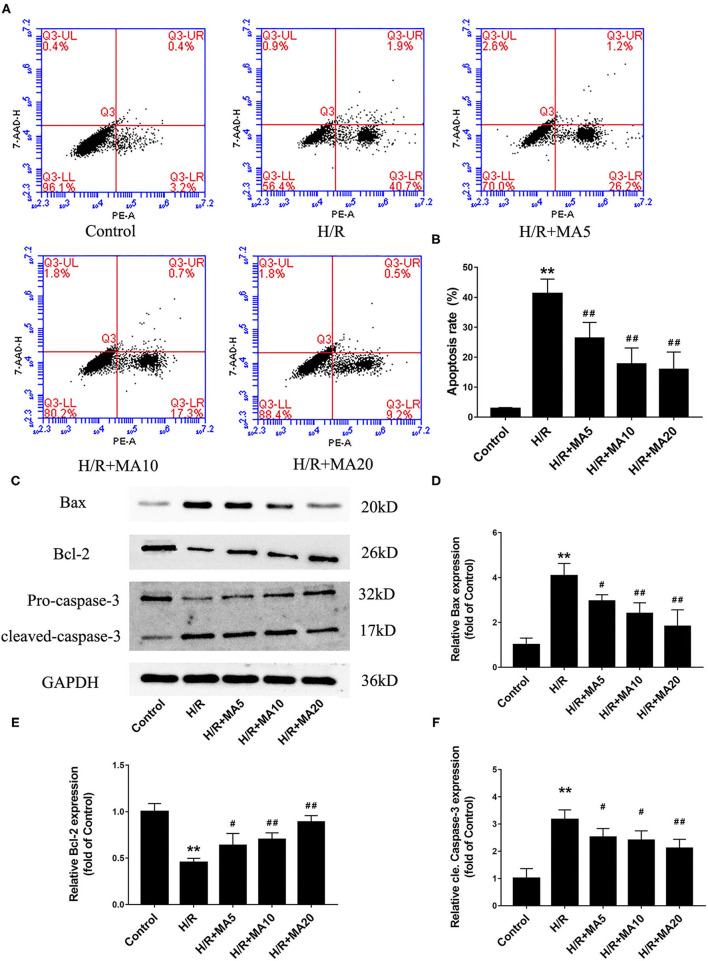
Figure 2.
The effects of MA on cardiomyocyte apoptosis and the expression of apoptosis-related proteins after H/R treatment. (A,B) After various treatments, the apoptosis is measured by Annexin V-PE/7-AAD using flow cytometry and the results are expressed in bar graphs. (C) Western blot was performed to assess the expression of apoptosis-related proteins (Bax, Bcl-2, and cleaved caspase-3) in H9c2 cell under H/R conditions. (D–F) The quantitative analysis of apoptosis-related proteins is shown in bar graphs. All the values are representative of at least three independent experiments and expressed as the mean ± SD. **P < 0.01 vs. control group; #P < 0.05 and ##P < 0.01 vs. H/R group.

