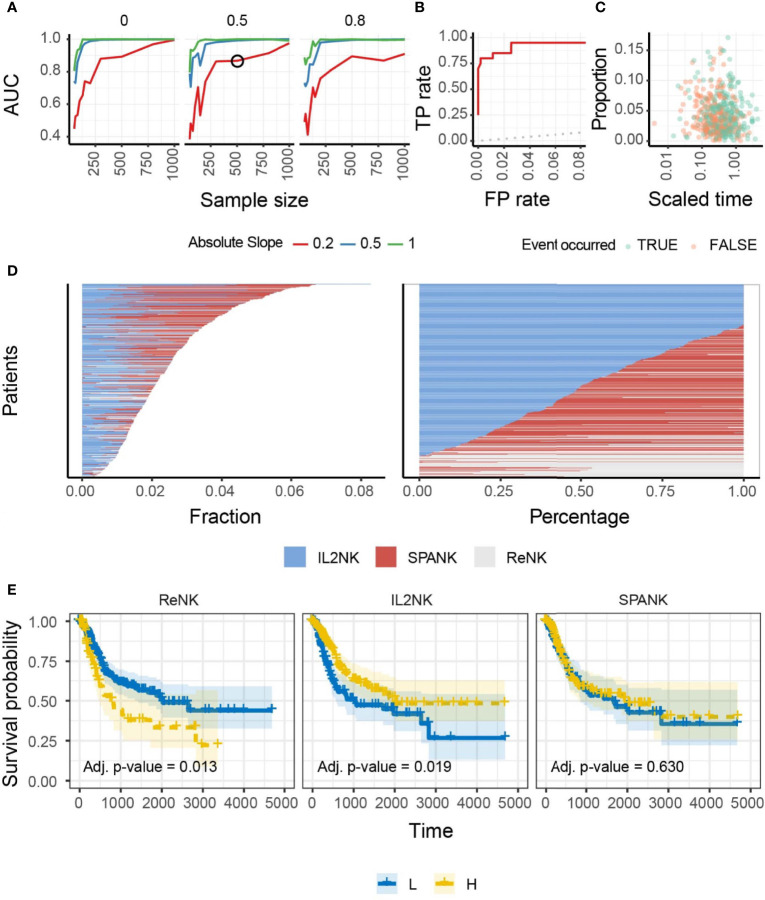
Figure 1.
Benchmark, overall abundance and survival associations of NK phenotypes in BLCA. (A) Accuracy of the inference of changes in proportion of IL-2-expanded NK cells from simulated mixtures. The detection of a significant proportional change when it exists in the simulation defined a true-positive. Data points represent the area under the curve (AUC) for mixtures created with a specific combination of sample size (x-axis), degree of change (slope; color-coded), and proportion of foreign cell type (facets; i.e., neurons, for which we do not include transcriptional profile in the training data). A simulation condition that represents the associations we detected in the TCGA database is circled. (B) Receiver operating characteristic (ROC) curve, measuring the accuracy (true-positive and false-positive) for the simulated mixture circled in (A). A curve touching the top-left corner (0 false-positive and 1 true-positive rates) would represent the best achievable performance. A curve overlapping the dotted line (45°) would represent a random detection of proportional changes. (C) The underlying association between cell type and time-to-event (e.g., survival days) of the simulated dataset circled in (A). Data points represent cell-type/sample pairs. (D) Abundance of NK cell phenotypes (fraction and percentage) for TCGA BLCA cohort; IL2NK is the most abundant NK cell phenotype in BLCA. (E) Kaplan–Meier survival curve for all three NK cell phenotypes for TCGA-BLCA; high tumor abundance of IL2NK, but not the ReNK or SPANK phenotypes, is associated with a favorable BLCA patient outcome (x-axis, days; y-axis, progression-free survival).

