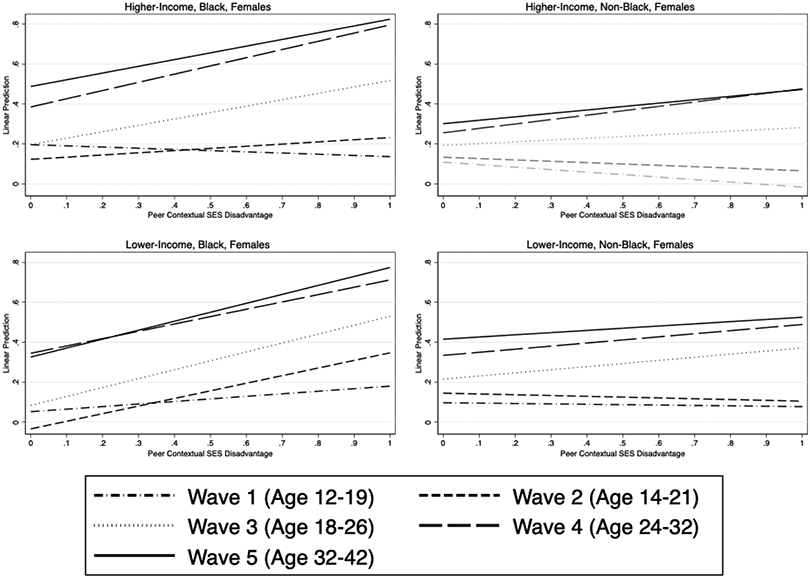
Figure 1a. Predicted Probability of Obesity across Levels of Peer Disadvantage, Females.

Notes: Figure 1a reflects the predicted probability of obesity based on Model 3 in Table 3, which report marginal effects from the regression of obesity across waves on peer disadvantage interacted with gender, race, and individual lower income status. The figure reflects longitudinal sample with data across Waves I-V for which longitudinal grand survey weights were available and include these weights (gsw12345). The approximate age range of individuals within each wave is reflected in parentheses. Source: Authors’ calculations from Add Health Data Waves 1 – 5.
