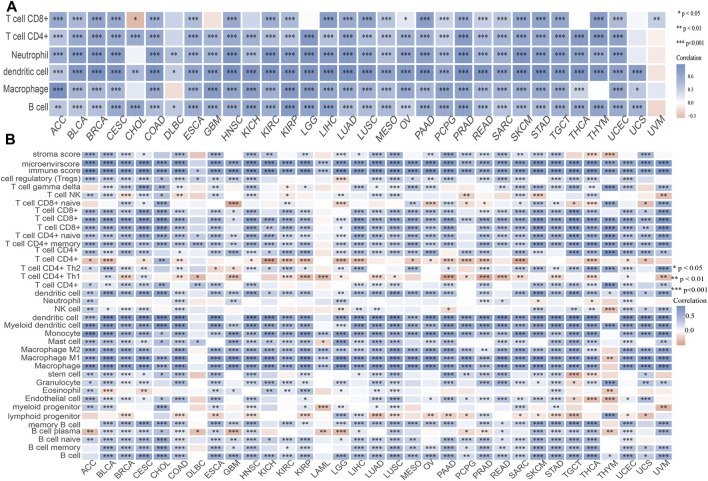
FIGURE 6.
Analysis of the correlation between the UBE2C expression and immune cell infiltration. (A) The correlation between UBE2C expression and immune cell infiltration in pan-cancer examined by the TIMER database. (B) The correlation between UBE2C expression and diverse immune cells infiltration in pan-cancer examined by X-Cell database. *p < 0.05, **p < 0.01, ***p < 0.001.

