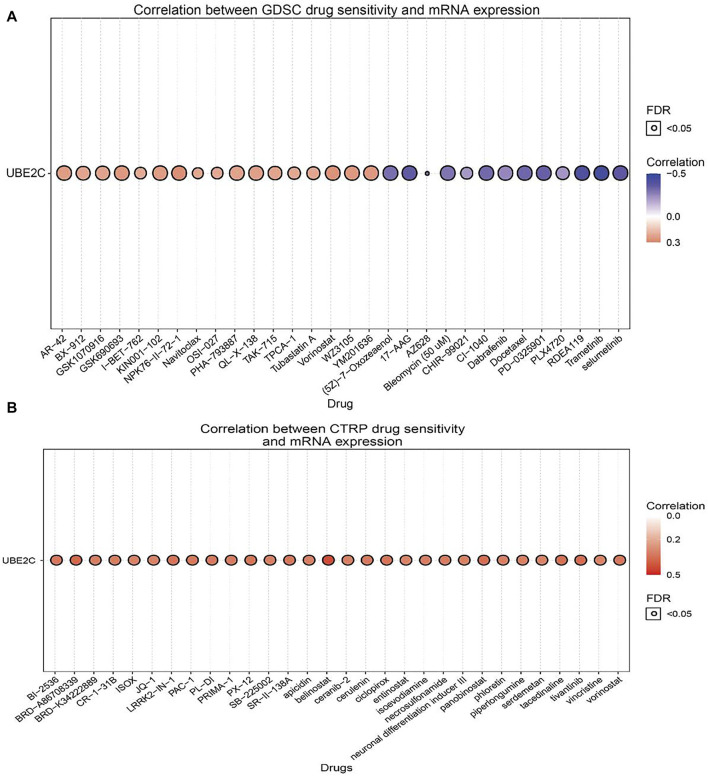
FIGURE 7.
Analysis of the correlation between UBE2C expression and drug sensitivity in diverse human cancer. (A) The correlation between UBE2C expression and drug sensitivity in diverse human cancer analysis by the GDSC database. (B) The correlation between UBE2C expression and drug sensitivity in diverse human cancer analysis by the CTRP database. *p < 0.05, **p < 0.01, ***p < 0.001.

