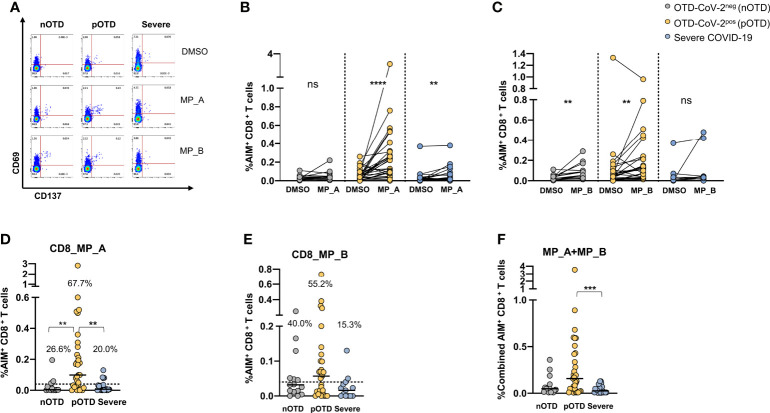
Figure 2.
Increased SARS-CoV-2 specific CD8 T cell responses in SARS-CoV-2-infected subjects with OTD. To evaluate SARS-CoV-2-Specific CD8+ T cell responses, PBMC collected from 3 cohorts of subjects were stimulated for 24h with two peptide megapools: MP_A and MP_B. In all experiments, DMSO was used as negative control. (A) FACS plot examples of CD69 and CD137 co-expression on total CD8+ T cells. (B) Frequency of AIM+ (CD69+ CD137+) CD8+ T cells measured after PBMC stimulation with MP_A, (C) MP_B megapool, or DMSO negative control is shown for the 3 different groups. (D) Activation of SARS-CoV-2 specific CD8+ T cells, in the presence of MP_A and (E) MP_B megapools, is shown as percentage AIM+ CD8+ T cells after subtraction of the DMSO background in three cohorts of subjects. Dotted black lines indicate cut-off values for positivity. (F) Combined AIM+ CD8+ T cells responses to DMSO-subtracted individual peptide megapools. The non-parametric Wilcoxon matched-pairs signed-rank test was used to compare data within the same group. Statistical comparison between three groups of subjects was done by the non-parametric Kruskal-Wallis test followed by Dunn’s multiple comparisons. ns, not significant. **p < 0.01; ***p < 0.001; ****p < 0.0001.

