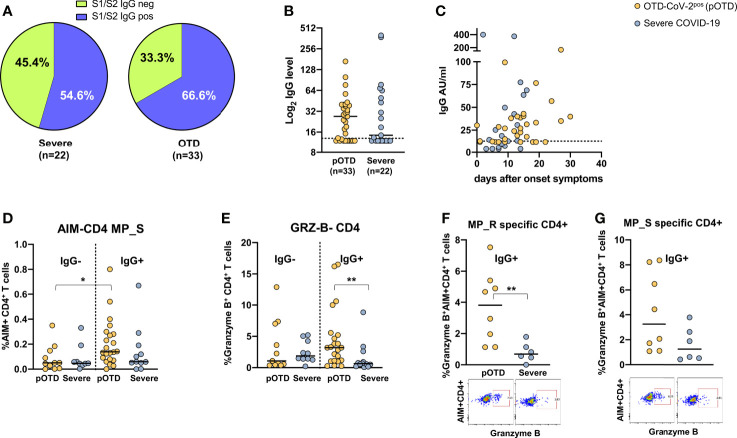
Figure 4.
Relationship between SARS-CoV-2 T cell and antibody responses in COVID-19 individuals. (A) Pie chart shows the percentage of positive (blue) and negative (green) S1/S2 IgG antibody subjects in OTD-CoV-2pos and severe patient cohorts. (B) Distribution of serum S1/S2 IgG levels in seroconverted anosmic/ageusic and severe COVID-19 individuals (IgG ≥ 13 AU/mL). (C) Association between time (days) from symptom onset and serum S1/S2 IgG levels. (D) Comparison of frequencies of AIM+ CD4+ T cells in response to the MP_S peptide pool in IgG-positive and -negative patients in OTD-CoV-2pos and severe COVID-19 groups. (E) Frequency of CD4+ T cells expressing granzyme B in OTD-CoV-2pos and severe COVID-19 patients stratified according to serum IgG positivity. (F, G) Frequency of AIM+ CD4 T cells expressing granzyme B in IgG- positive OTD-CoV-2pos and severe COVID-19 patients following stimulation with MP_R and MP_S respectively. Mann-Whitney U test was used to compare differences between two groups. Statistical comparison between four groups of subjects was assessed by the non-parametric. *p < 0.05; **p < 0.01.

