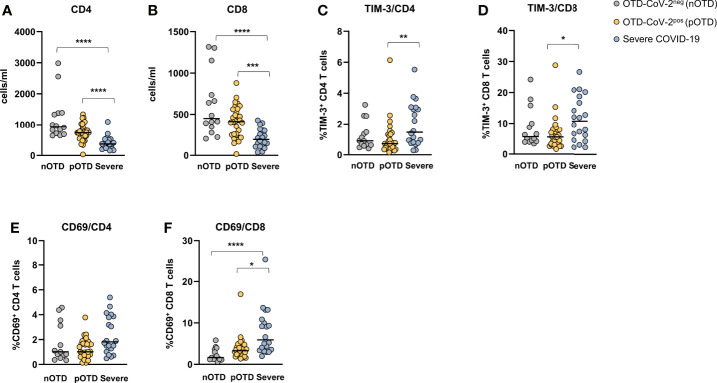
Figure 6.
Hyperactivated/exhausted T cell phenotype in patients with severe COVID-19. Absolute numbers of circulating (A) CD4+ and (B) CD8+ T cells. (C, D). Expression of the TIM-3 checkpoint molecule and (E, F) of the CD69 activation marker on CD4+ and CD8+ T cells. Statistical comparison between three groups of subjects was assessed by the non-parametric Kruskal-Wallis test followed by Dunn’s multiple comparisons. *p < 0.05; **p < 0.01; ***p < 0.001; ****p < 0.0001.

