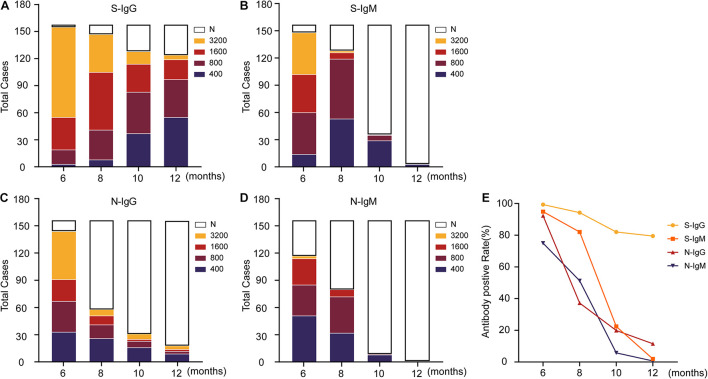
FIGURE 2.
Changing trend of the titers of IgG, IgM and neutralizing antibodies against SARS-CoV-2 S/N in patients. (A–D) Indicates the change in antibody titers at different time points, where N indicates that the titers have dropped below the ELISA cutoff and cannot be detected. (E) Displays the changing trend of the antibody-positive rate. The data are shown as the mean ± SEM, and the significance is expressed as ns, P > 0.05.

