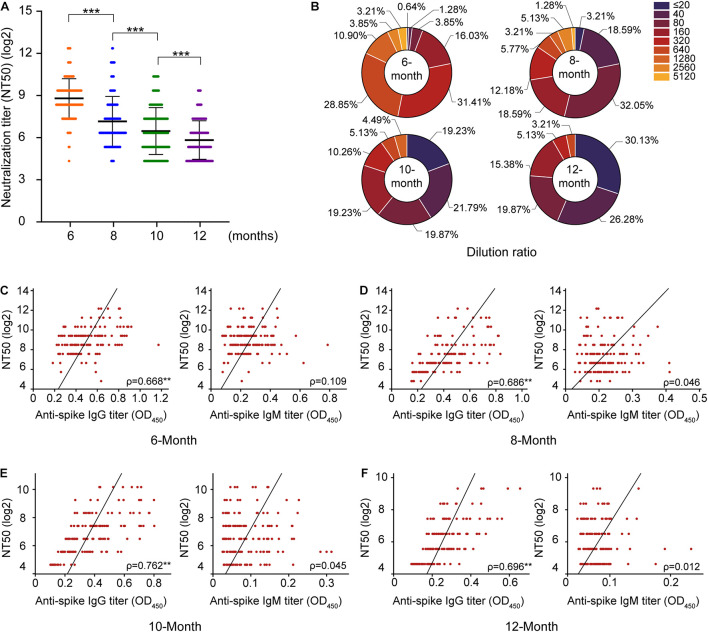
FIGURE 3.
Evaluation of the changes in neutralizing antibody titers in 156 serum samples. According to the classification at different time points after convalescence, (A) reflects the change in the neutralization titer of serum from convalescent patients, and the y-axis represents the log2 of the neutralization titer. (B) Reflects the change in the proportion of the neutralization titer in serum; (C–F) indicates the analysis of the correlations of S protein IgG and IgM with neutralizing antibodies, respectively. ***P < 0.001.

