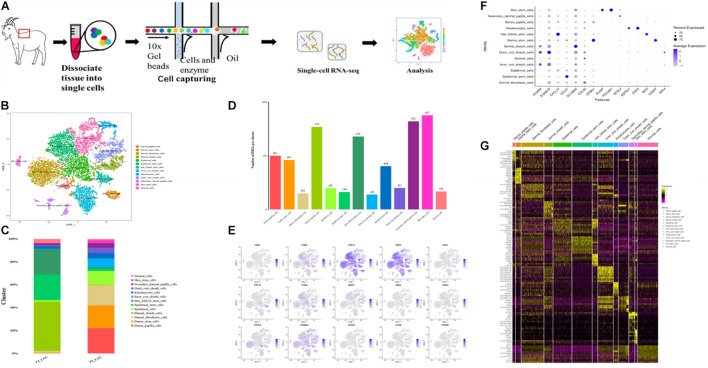
FIGURE 1.
Identification of cashmere goat skin cell types. (A) Schematic representation of cashmere goat skin tissue preparation for single-cell transcriptome analysis. (B) t-SNE clustering of cells based on expression levels of genes. Each color represents a class of cells. (C) Graph showing percentage of each cluster in two samples. (D) Number of DEGs in each cluster. (E) t-SNE plots of marker genes expression value in per cluster. (F) Highly expressed genes in every cell type. (G) Heat map of the top 10 specific marker genes.

