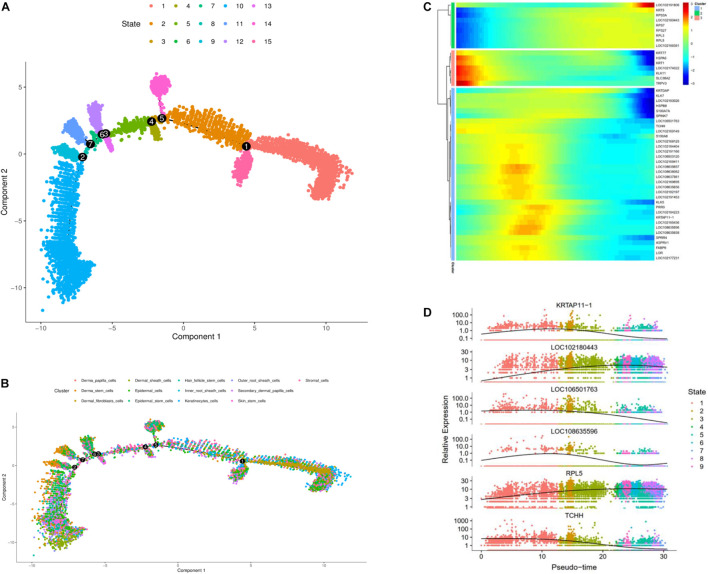
FIGURE 2.
Cell trajectory analysis on goat skin cells. (A) Monocle 2 cell trajectory analysis of goat skin cells. (B) Monocle 2 cell trajectory colored according to the identity of 13 goat skin cells. (C) Clustering of genes represent differential expression patterns across goat skin cell populations. (D) Dynamic expression values of top six different genes are plotted on pseudo-time. X-axis represents pseudo time, and Y-axis represents gene expression levels.

