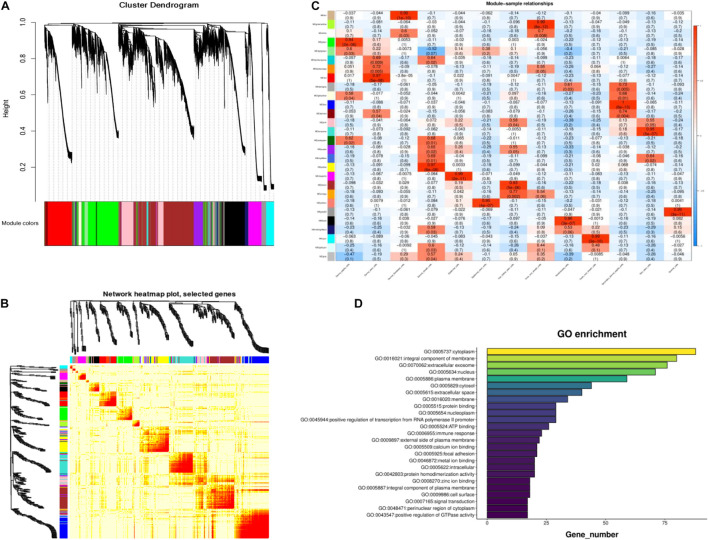
FIGURE 3.
Module identification of cashmere goat skin. (A) Cluster dendrogram of all screened genes. (B) TOM of all screened genes. (C) Heat map of the correlation between modules and cashmere skin cells. Each specific color represents the specific gene module. (D) GO analysis of the core genes in blue module.

