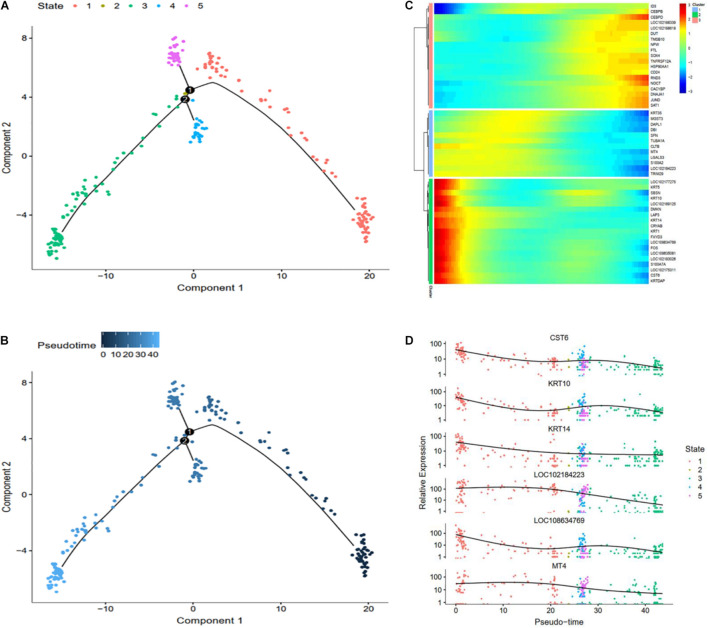
FIGURE 7.
Cell trajectory analysis in DPCs of goat skin. (A) Monocle 2 cell trajectory of goat DPCs. (B) Pseudo-time is displayed in a dark to light blue gradient and indicates the start of pseudo-time. (C) Clustering of top 50 genes exhibiting in DPCs. (D) Expression levels of six responsive genes in DPCs. X-axis represents pseudo-time, Y-axis represents gene expression levels.

