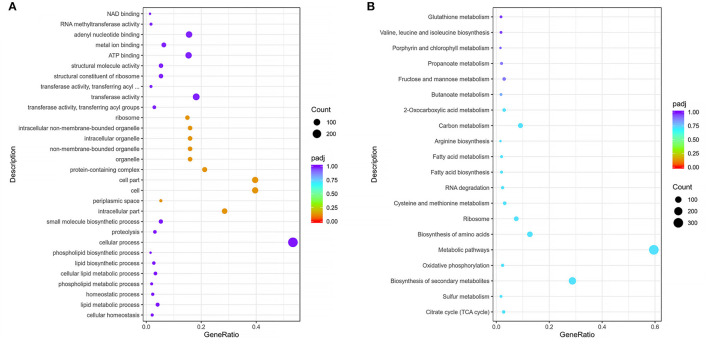
Figure 7.
Scatter plot of GO and KEGG enrichmen. (A) Top 30 enriched GO function and DEGs numbers enriched in each function of Pm3/Pm64. (B) Top 20 enriched KEGG pathways and the number of DEGs in of Pm3/Pm64. The abscissa represents the ratio of DEGs annotated to the total differential genes; the ordinate represents the GO Term and KEGG pathway, respectively; the size of the point represents the number of annotated genes; the color from red to purple represents the decreasing significance of enrichment.

