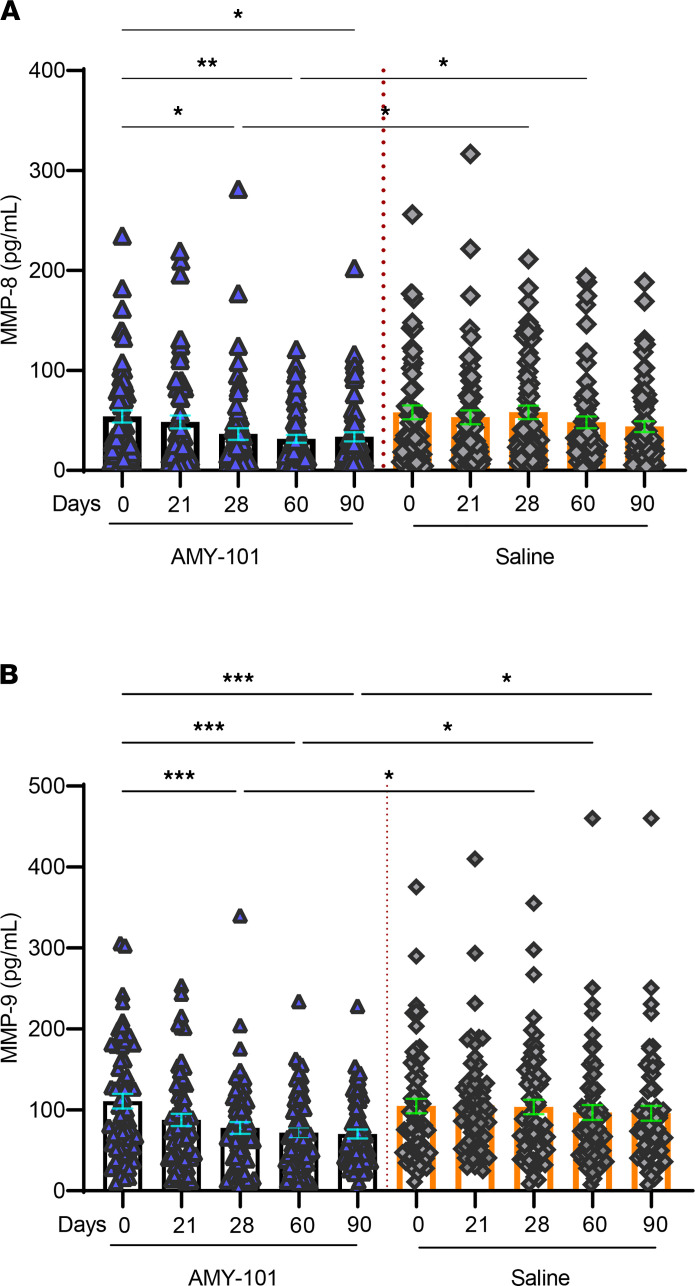
Figure 5. Changes in the GCF levels of MMP-8 and MMP-9 following treatment with AMY-101.
The levels of MMP-8 (A) and MMP-9 (B) were measured in the GCF from 2 separate sites on each treatment side (AMY-101 or saline) and were compared within groups (e.g., different time points after AMY-101 treatment) as well as between groups (i.e., AMY-101 vs. saline). The LSM, its 95 % CI, SE, and LSM difference, along with its SE, 95% CI, and the P value, were obtained through a GEE method with normal distribution and identity link including treatment group, study visit (day 21, day 28, day 60, and day 90), and interaction between the treatment group and study visit as fixed effects with the baseline as the covariate. Dot plots with whiskers represent individual values and the mean ± SE. Within-group comparisons were performed using repeated-measures 1-way ANOVA followed by Sidak’s multiple-comparison test. *P < 0.05, **P < 0.01, and ***P < 0.001. For baseline (day 0), day 21, and day 28, n = 62; for day 60, n = 56; and for day 90, n = 60.

