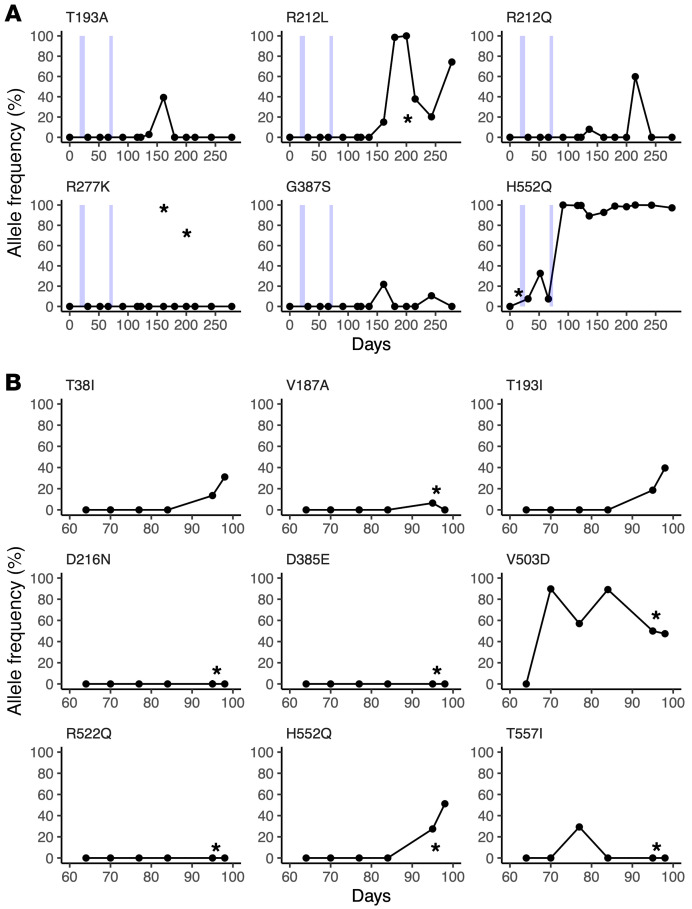
Figure 3. Nonsynonymous mutational changes and allele frequencies in HN protein across long-term persistent HPIV3 infection.
Patient 1 (A); patient 2 (B). The mutational change is shown above each subplot, with all changes relative to the day 0 majority consensus for that patient. Variants above an allele frequency of 5% and a depth of 10 reads in at least 2 samples for patient 1 and 1 sample for patient 2 are depicted, given the increased number of samples. Light blue boxes indicate time periods in which patient 1 was treated with DAS181. Sample collection dates are given relative to the first sample and plotted on the x axis for each plot. Samples collected by nasal swab are represented by dots, and BAL samples are marked with an asterisk.

