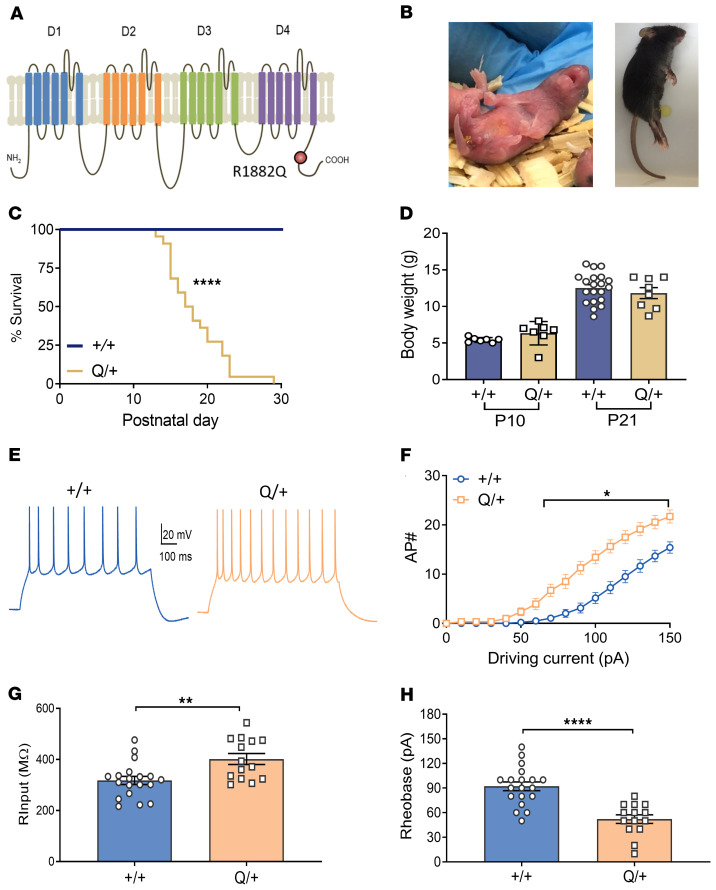
Figure 1. Disease phenotype of the Q/+ mouse model.
(A) Schematic presentation of SCN2A channel depicting 4 domains (D1–D4), each comprised of 6 transmembrane regions, and the intracellular N and C-terminus of the channel. The p.R1882Q variant is predicted to affect the C-terminus of the channel. (B) Images of Q/+ mice undergoing spontaneous seizure at P1 (left) and P25 (right). (C) Survival curves of Q/+ and +/+ mice. (+/+ n = 19, Q/+ n = 22). ****P < 0.0001, log rank test. (D) Body weight measured on P10 and P21 (+/+ n = 7–20, Q/+ n = 7–8). (E) Representative voltage traces from a neuron injected with 100 pA current. Scale bar applies to all traces. (F) Input-output relationship generated for each injected current step (+/+ n = 3 mice, 20 cells, Q/+ n = 3 mice, 14 cells). *P < 0.05 (F (15, 512) = 6.301, 2-way ANOVA with Sidak’s multiple comparison. (G) Input resistance. **P < 0.005 (t = 3.22, df = 31). (H) Rheobase. **** P < 0.0001 (t = 5, df = 31), unpaired t test. Data are represented as mean ± SEM.

