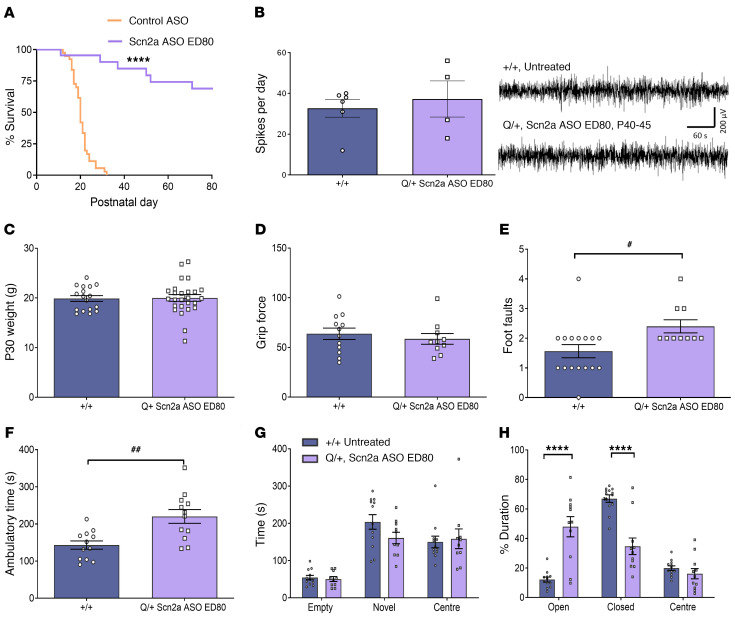
Figure 6. Effect of administering Scn2a ASO ED80 in Q/+ mice at P1.
(A) Survival curves of Q/+ mice i.c.v. injected with Scn2a ASO ED80 or the negative control ASO at P1. Control ASO (50 μg, n = 39), Scn2a ASO ED80 (10 μg, n = 22). (B) Left: number of spikes during 24-hour ECoG recorded at P40–P45 (+/+ n = 6, Scn2a ASO ED80 Q/+ n = 4). Right: representative ECoG traces. Scale bar applies to all traces. (C) Body weight measured at P30. (D) Grip force. (E) Number of foot faults in grid walk test. (F) Ambulatory time measured in locomotor chamber. (G) Duration spent in different arms of the elevated plus maze. (H) Time spent in the different compartments of 3-chamber social interaction test. ##P < 0.005 (t = 3.557, df = 22), #P < 0.05 (t = 2.518, df = 24), unpaired 2 tailed t test. ****P < 0.0001, (F (2, 63) = 36.72), 2-way ANOVA with Sidak’s multiple comparison, n = 10 to 26 per genotype. Data are represented as mean ± SEM.

