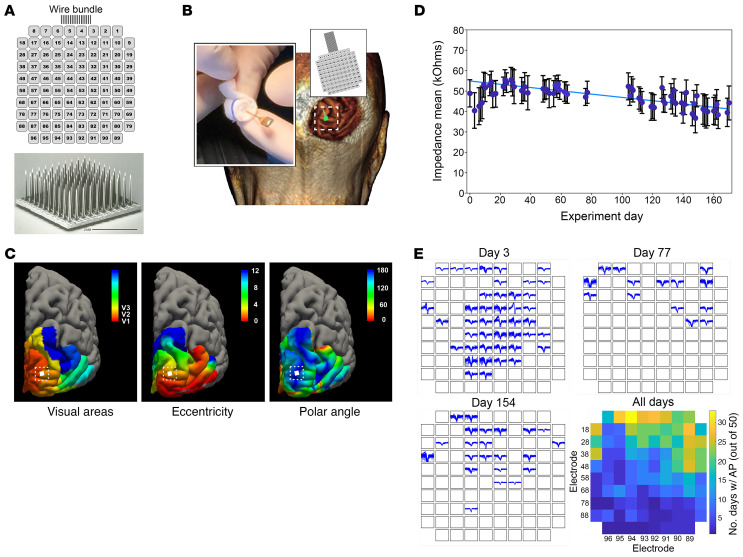
Figure 1. Utah Electrode Array (UEA) implantation and electrophysiological recordings.
(A) Scanning electron microscopy image of the UEA and numbering system used to identify specific electrodes (electrode side shown). (B) Location of the UEA implantation site on the right occipital cortex. Inset: Image of the UEA to be implanted during surgery. (C) Predicted retinotopic map organization superimposed on the 3D reconstruction of the volunteer’s cerebral cortex with the implantation site indicated (left, location of visual areas; middle, eccentricity; and right, polar angle). (D) Average electrode impedances across the 6-month study period. The mean impedances increased by 20% in the first week, and gradually decreased toward their initial values (blue line). (E) Examples of recorded waveforms on days 3, 77, and 154 with summary statistics of recorded multiunit responses. Color in the heatmap represents the number of days on which more than 50 reliable action potentials were recorded on a given electrode over the 2-minute recording period.

