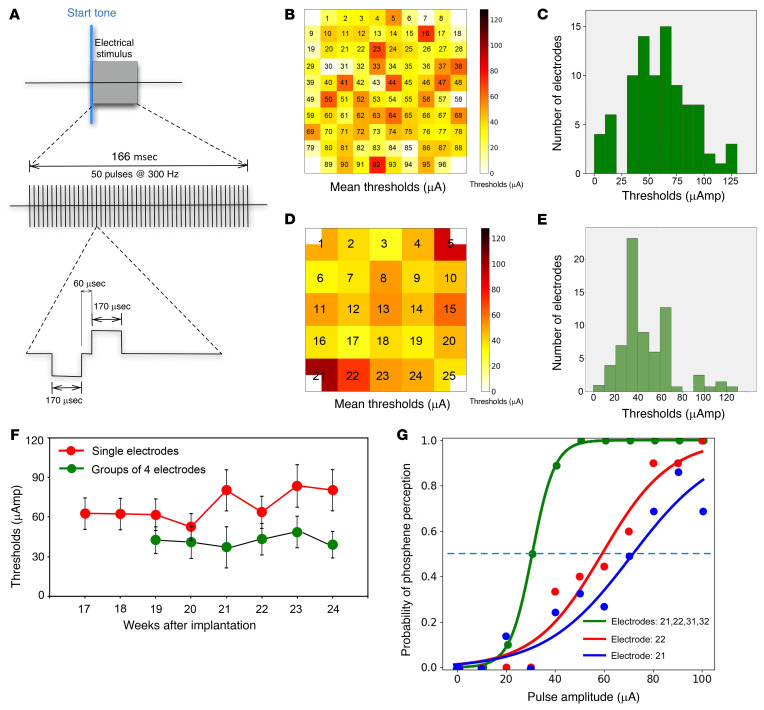
Figure 3. Phosphene thresholds.
(A) Diagram illustrating the stimulation parameters of the biphasic pulse waveforms that were used for the quantification of the thresholds. (B) Distribution of phosphene thresholds for stimulation via single microelectrodes. Electrode tips are pointing away from the page. (C) Distribution of the thresholds for all the electrodes on week 21. (D) Distribution of phosphene thresholds evoked by simultaneous stimulation via sets of 4 contiguous (abutting) electrodes. Electrode tips are pointing away from the page. (E) Histogram of averaged thresholds for stimulation via the sets of 4 electrodes. (F) Evolution of the threshold for stimulation of single electrodes and for groups of 4 electrodes. Data presented as mean ± SEM. (G) Representative psychometric curves generated in response to stimulation (biphasic pulses, with a phase duration of 170 μs/phase and a frequency of 300 Hz) via 1 and 4 abutting electrodes.

