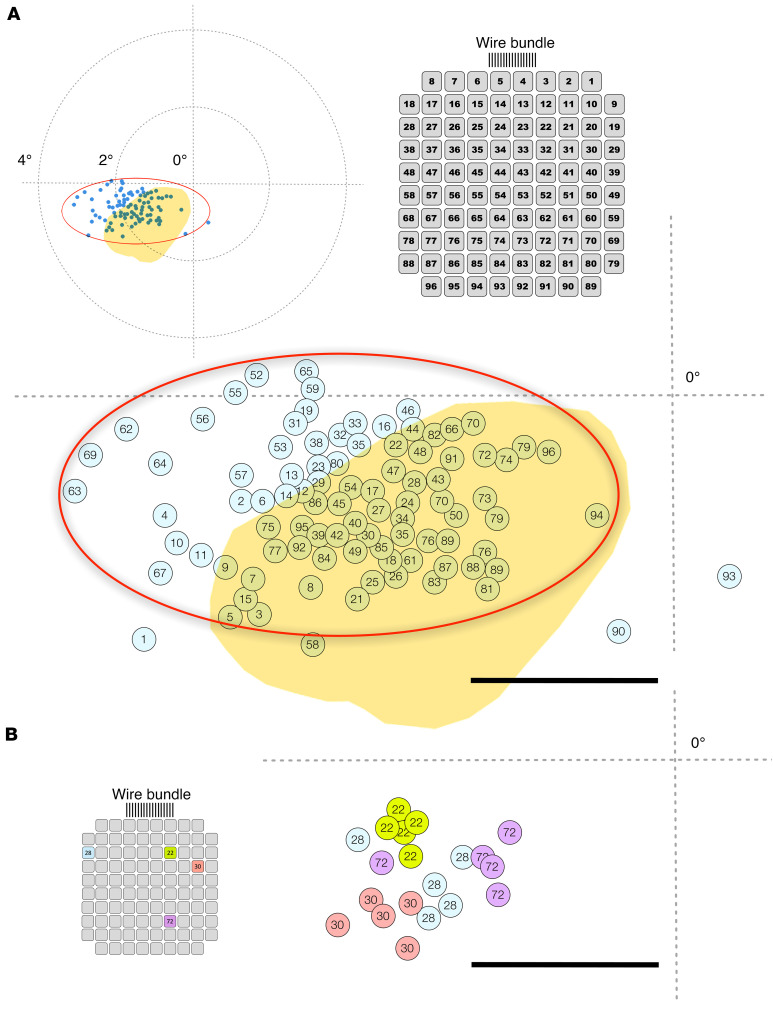
Figure 5. Phosphene map and relative brightness and size of perceived phosphenes.
(A) Location of the perceived phosphenes (blue dots) and electrode numbering view from the pad side. The cross indicates the center of the subject’s visual field (the intersection of her horizontal and vertical meridians). Yellow region: Expected location of the phosphenes based on a standard retinotopic map superimposed on the anatomy of the visual cortex of the patient using the procedures described by Benson et al. (22, 23) and the selected implantation site. Calibration bar = 1 degree. (B) Changes in the location of the perceived phosphenes for the same 4 electrodes in 5 different trials. Calibration bar = 1 degree.

