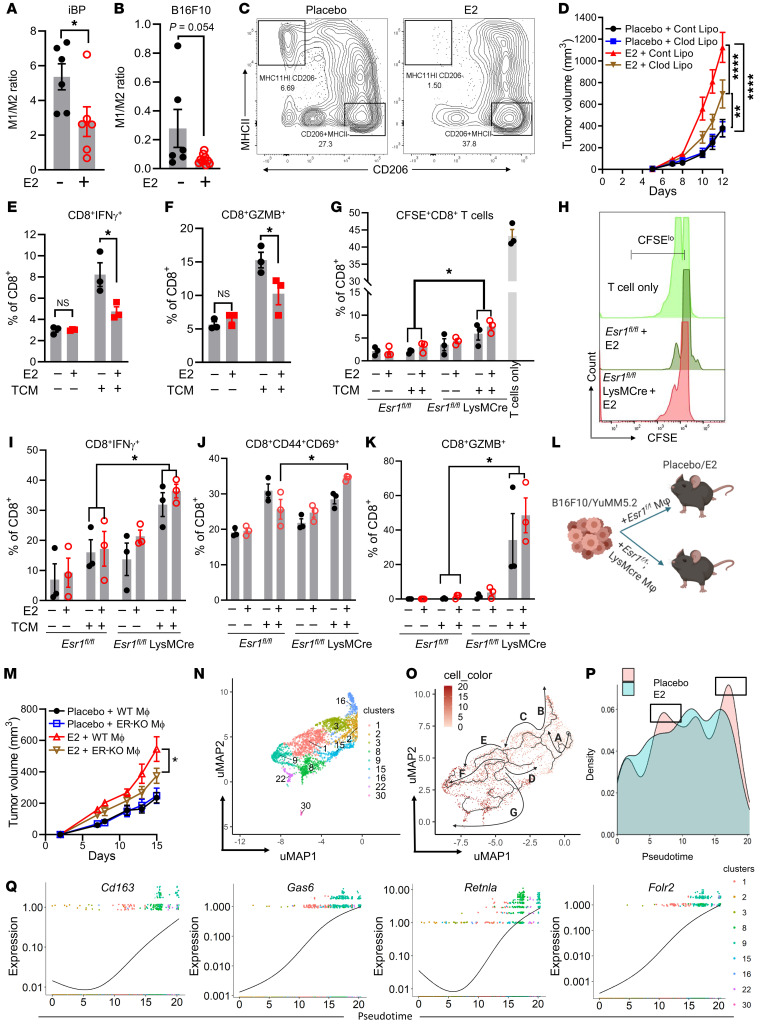
Figure 4. E2 regulates TAM function.
(A–C) Ratio of M1/M2 macrophages in iBP (n = 6) (A) and B16F10 (n = 6–10) (B) tumors from placebo- and E2-treated mice and representative flow cytometric plots of M2 and M1 macrophages in the B16F10 model (C). (D) Growth of B16F10 tumors (n = 12) upon depletion of macrophages by clodronate liposomes (Clod Lipo) in ovariectomized mice supplemented with placebo or E2. Cont Lipo, control liposome. (E and F) Quantification of IFN-γ+CD8+ T cells (E) and GZMB+CD8+ T cells (F) (n = 3) that were cocultured with BMDMs differentiated in NM or TCM and treated with either DMSO or E2 (1 nM). (G and H) CFSE dilution and quantification representing the proliferation of CFSElo/–CD8+ T cells (n = 3) after coculturing with BMDMs from Esr1fl/fl and Esr1fl/fl LysMCre mice, differentiated in either normal media or TCM (B16F10), followed by treatment with either DMSO or E2 (1 nM). (I–K) Quantification of CD8+IFN-γ+, CD8+CD44+CD69+, and CD8+GZMB+ T cells (n = 3) from the same experiment as in G. (L) Schematic of tumor comixing methodology. (M) Syngeneic tumor growth of YuMM5.2 (5 × 10⁵) cells comixed with BMDMs from either Esr1fl/fl LysMCre mice or their Esr1fl/fl littermate controls (1:1) in ovariectomized mice supplemented with either placebo or E2. Esr1fl/fl BMDMs plus YuMM5.2 (Placebo + WT MΦ; black; n = 10); Esr1fl/fl LysMCre BMDMs plus YuMM5.2 (Placebo + ER-KO MΦ; blue; n = 10); Esr1fl/fl BMDMs plus YuMM5.2 (E2 + WT MΦ; red; n = 10); and Esr1fl/fl LysMCre BMDMs plus YuMM5.2 (E2 + ER-KO MΦ; brown; n = 10). (N) uMAP representation of macrophage/monocyte subclusters as determined by scRNA-Seq. (O) Trajectory analysis depicting the differentiation of monocytes into different lineages of macrophages. (P) Density of cells in macrophage/monocyte subclusters along a pseudotime gradient. (Q) Expression of M2-associated genes (Cd163, Lgr2, Retnla, and Folr2) in macrophage clusters along the pseudotime axis. Data in E–K are representative of 2 independent experiments. Data are expressed as individual data points and indicate the mean ± SEM. *P < 0.05, **P < 0.01, and ****P < 0.0001, by Student’s t test (A and B), 1-way ANOVA (E–G, I–K) and by 2-way ANOVA followed by Bonferroni’s multiple-correction test (D and M). MΦ, macrophages.

