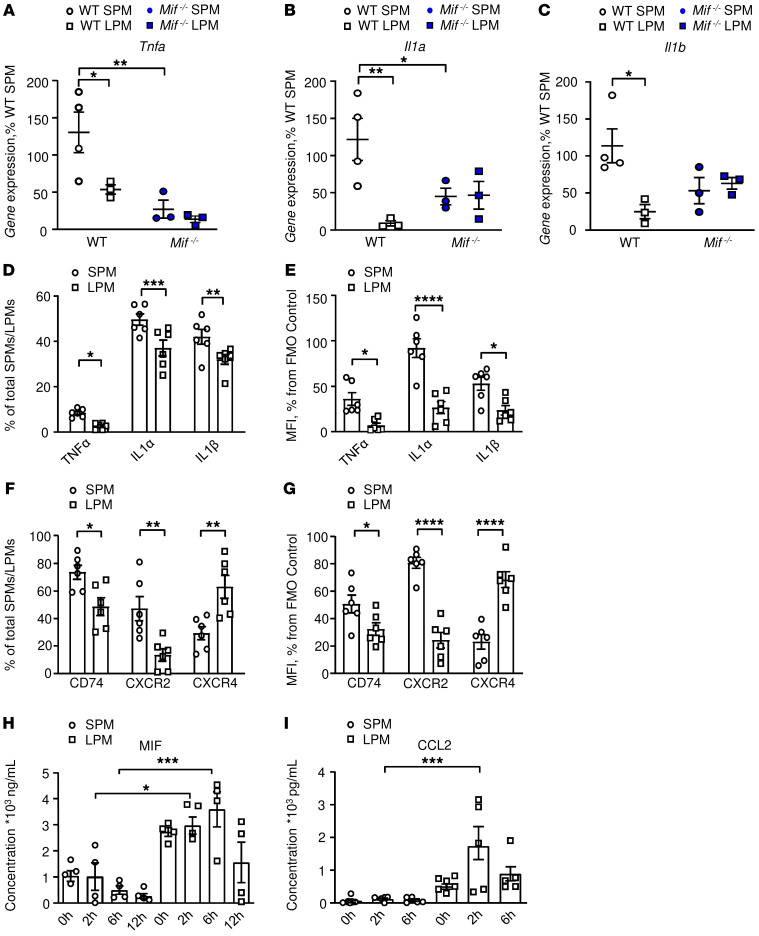
Figure 6. LPMs express higher levels of MIF and CCL2 than SPMs.
(A–C) Confirmation of MIF-dependent regulation of Tnfa, Il1a, and Il1b expression by SPMs in contrast to LPMs. Quantitative expression by qPCR of (A) Tnfa, (B) Il1a, and (C) Il1b in SPMs and LPMs isolated from WT and Mif–/– animals 22 hours after CLP. n = 4 animals per group with replication (2-way ANOVA with Sidak’s multiple-comparison test). (D–G) We confirmed cellular protein expression in SPMs and LPMs by flow cytometry. Intracellular cytokine expression assessed by flow cytometry in post-CLP SPMs and LPMs showing (D) cytokine-expressing macrophages as percentage of total SPMs/LPMs and (E) MFI as percentage of fluorescence-minus-one (FMO) control. (F and G) Flow cytometry analysis of the MIF receptors CD74, CXCR2, and CXCR4 expressed by SPMs and LPMs after CLP, (F) expressed as percentage of total SPMs/LPMs, and as (G) MFI percentage of FMO control. Results are from 3 independent experiments, n = 6 animals per group, 2-way ANOVA with Sidak’s multiple-comparison test. (H and I) In vitro confirmation of induced production of MIF and CCL2 by LPMs versus SPMs. (H) MIF and (I) CCL2 production from WT SPMs and LPMs stimulated with LPS (100 ng/mL, 1 × 10⁵ cells/well). Cytokine concentrations in supernatants were measured by ELISA. The results are from 3 independent experiments, and data are expressed as mean ± SEM, n = 5 to 11 samples per time point. Significance determined by 1-way ANOVA with Tukey’s multiple-comparison test (H) or Kruskal-Wallis test with Dunn’s multiple-comparison test (I). *P < 0.05; **P < 0.01; ***P < 0.001; ****P < 0.0001.

