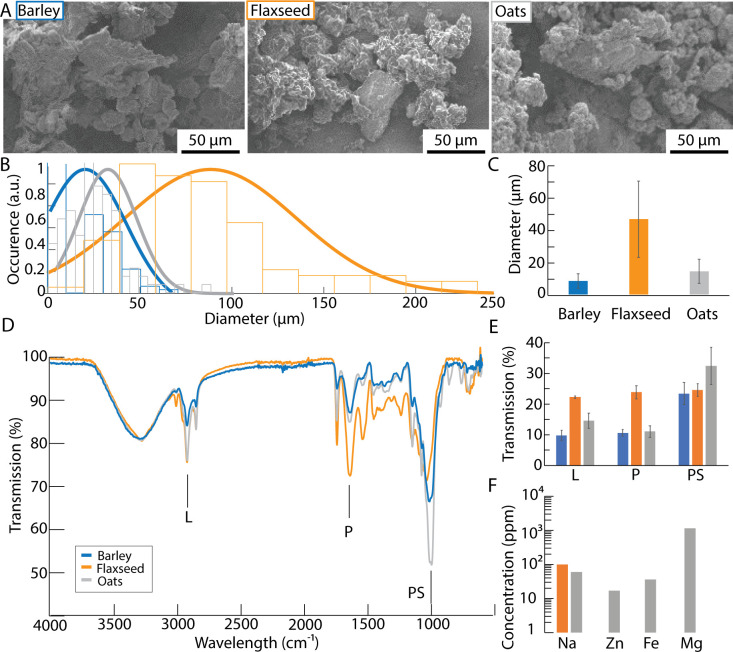
Fig 2.
(A) Electron micrographs of grounded barley (blue), flaxseed (orange) and oats (grey). Size distribution (B) and average diameter and standard deviation (C) for each food supplement. (D) Representative FTIR spectra. L indicates lipides, P proteins, and PS polysaccharides. (E) Transmission intensity corresponding to the content in lipides, proteins, polysaccharides obtained from the FTIR. (F) Mineral concentration in each supplement.

