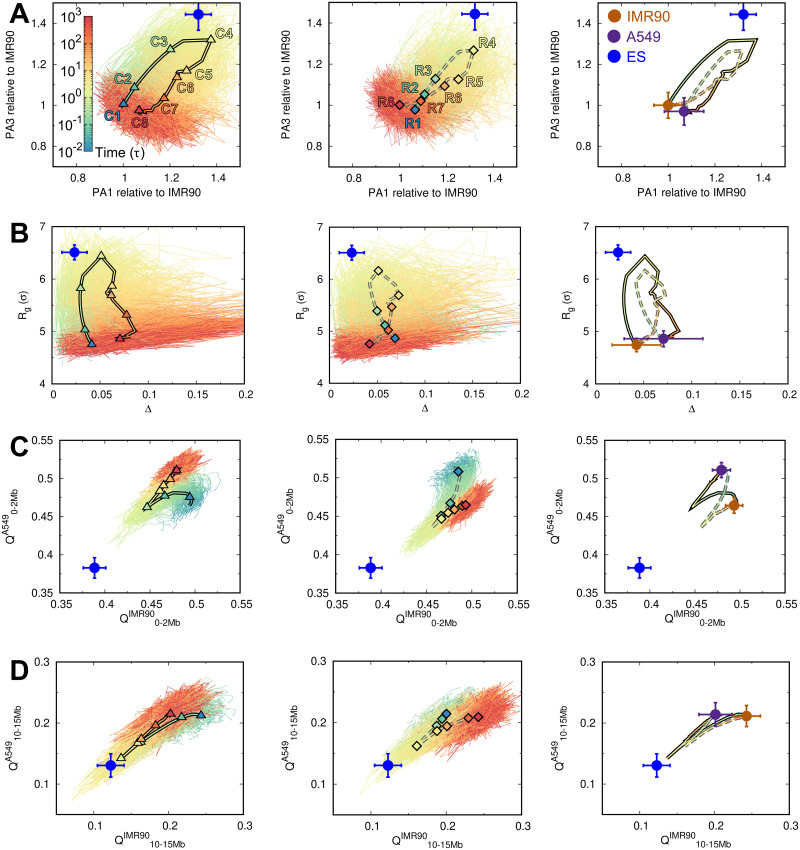
Fig 3. The pathways of chromosome structural transitions during cell cancerization and reversion.
The pathways are projected onto the order parameters of the chromosome with all trajectories presented for cancerization (Left) and reversion (Middle). The 8 stages are indicated by triangles (“C1”-“C8” in cancerization, Left) and diamonds (“R1”-“R8” in reversion, Middle) on the averaged pathways of the cancerization (solid line) and reversion (dashed line), respectively. The averaged pathways are additionally shown and colored by time (Right). The quantities of the chromosome in the IMR90, A549, and ES cells are correspondingly placed as brown, purple and blue points, respectively. The pathways are projected onto (A) the extensions of the longest and the shortest principal axes (PA1 and PA3), (B) the radius of gyration (Rg) and the aspheric quantity (Δ), contact similarity in terms of the fraction of native contact Q to the IMR90 and A549 at (C) local range (0–2Mb), and (D) long-range (10–15Mb). The data of the ES cell are obtained from our previous work [45].

