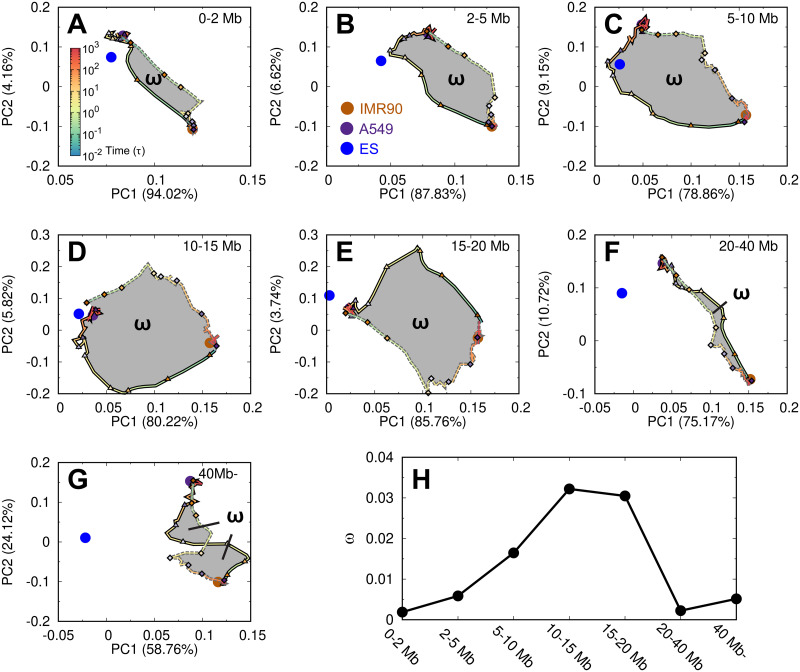
Fig 5. The pathways of the chromosome structural transition during cell cancerization and reversion.
The PCA plots on the contact matrix Pobs/Pexp evolving with the time during the processes projected on the first two PCs. The plots are further divided into different contact ranges (A-G). The reference points from the IMR90, A549 and ES cells are plotted as brown, purple and blue points, respectively. The 8 stages during the cancerization paths (solid lines) and reversion paths (dashed lines) are indicated by the triangles and diamonds, respectively. The hysteresis loop (ω) is colored grey in (A-G), and the area is calculated for different contact ranges (H).

