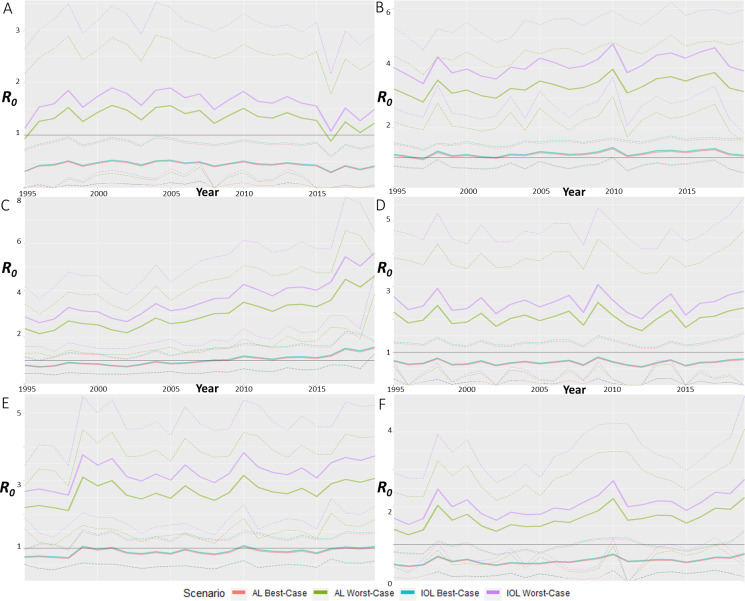
Fig 2. R0 estimations for best- and worst-case scenarios from 1995 to 2019 for the significant UCLs.
CHIKV R0 from 1995 to 2019 by averaging monthly estimations for each year for A) Brisbane, B) Cairns, C) Darwin, D) Rockhampton, E) Thursday Island and F) Townsville. Best- and worst-case scenarios were estimated using the limits of each variable from the R0 equation, where best-case correlates with least transmission and worst-case correlates with most transmission of CHIKV. Each scenario also has upper and lower standard deviation limits, with averages in bolder lines.

