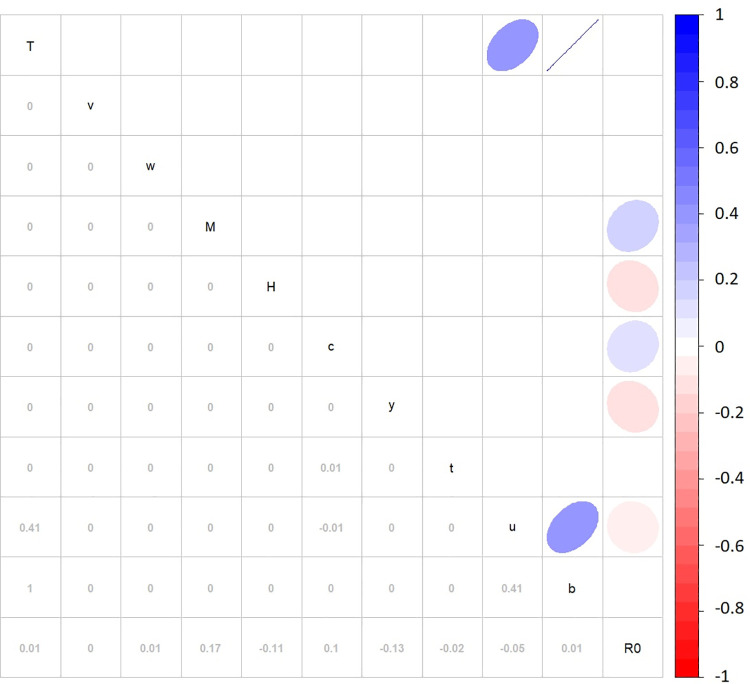
Fig 3. Sensitivity analysis using correlation matrix of R0 variables.
Sensitivity analysis was performed by Partial Rank Correlation Coefficient using Monte Carlo methods and Latin Hypercube Sampling. Numeric and graphic displays of the correlation coefficient are displayed in the lower left-hand side segment and the upper right-hand side, respectively. The colour and direction of ellipse relates to the degree of correlation between parameters. The variables are displayed diagonally, where T is average temperature, v is human-to-vector transmission rate, w is vector-to-human transmission rate, M is mosquito population density, H is human population density, c is vector control efficiency, y is infectious period, t is extrinsic incubation period, u is vector mortality rate, b is vector biting rate, and R0 is the basic reproduction number.

