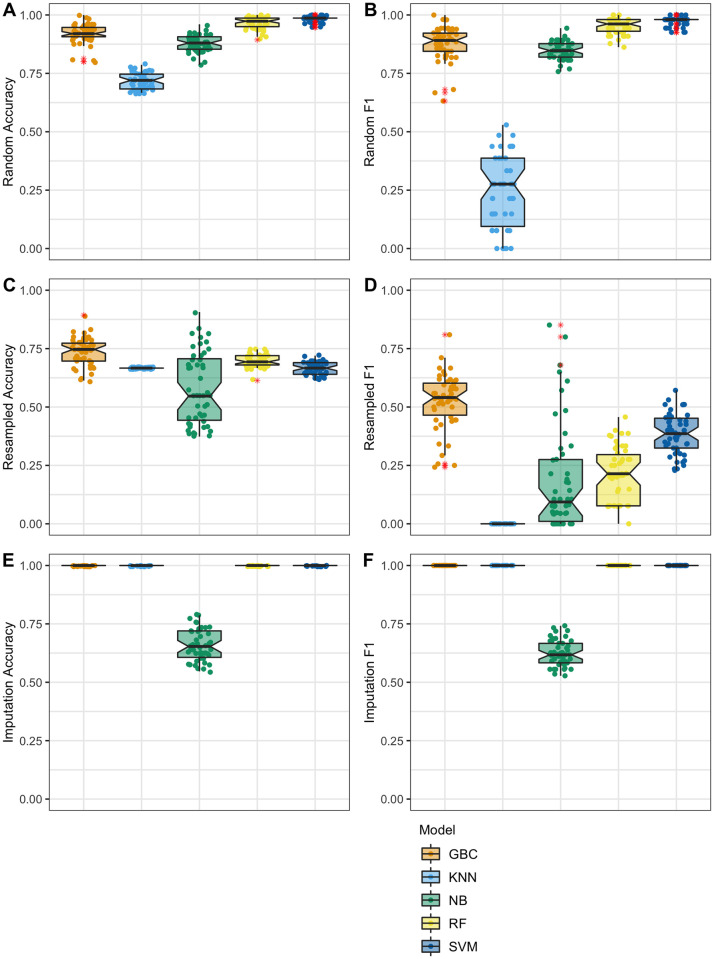
Fig 2. Classification accuracy using copy number data.
Fabricated data was mixed with real data and given to four machine learning models for classification. Data shown represents 50 trials for 50 different fabricated dataset mixes. Features in this dataset are the copy number values for each sample. Outliers are shown as red asterisks; these same outliers are shown also as normally colored points in jittered-point overlay. A. Results for data fabricated with the random method, mean classification accuracy: RF 97% (+/- 2.5%), SVM 98% (+/- 1.5%), GBC 92% (+/- 4.2%), NB 88% (+/- 3.5%), KNN 72% (+/- 3.4%). B. Results for data fabricated with the random method, mean classification F1: RF 0.95 (+/- 0.03), SVM 0.98 (+/- 0.02), GBC 0.88 (+/- 0.07), NB 0.85 (+/- 0.04), KNN 0.25 (+/- 0.16) C. Results for data fabricated with the resampling method, mean classification accuracy: RF 70% (+/- 2.6%), SVM 67% (+/- 2.7%), GBC 74% (+/- 6%), NB 58% (+/- 15.2%), KNN 67% (+/- 0%). D. Results for data fabricated with the resampled method, mean classification F1: RF 0.21 (+/- 0.12), SVC 0.38 (+/- 0.09), GBC 0.53 (+/- 0.12), NB 0.19 (+/- 0.23), KNN 0 (+/- 0). E. Results for data fabricated with the imputation method, mean classification accuracy: RF 100% (+/- 0%), SVM 100% (+/- 0%), GBC 100% (+/- 0%), NB 66% (+/- 6.7%), KNN 100% (+/- 0%). F. Results for data fabricated with the imputation method, mean classification F1: RF 1 (+/- 0), SVM 1 (+/- 0), GBC 1 (+/- 0), NB 0.62 (+/- 0.05), KNN 1 (+/- 0).

