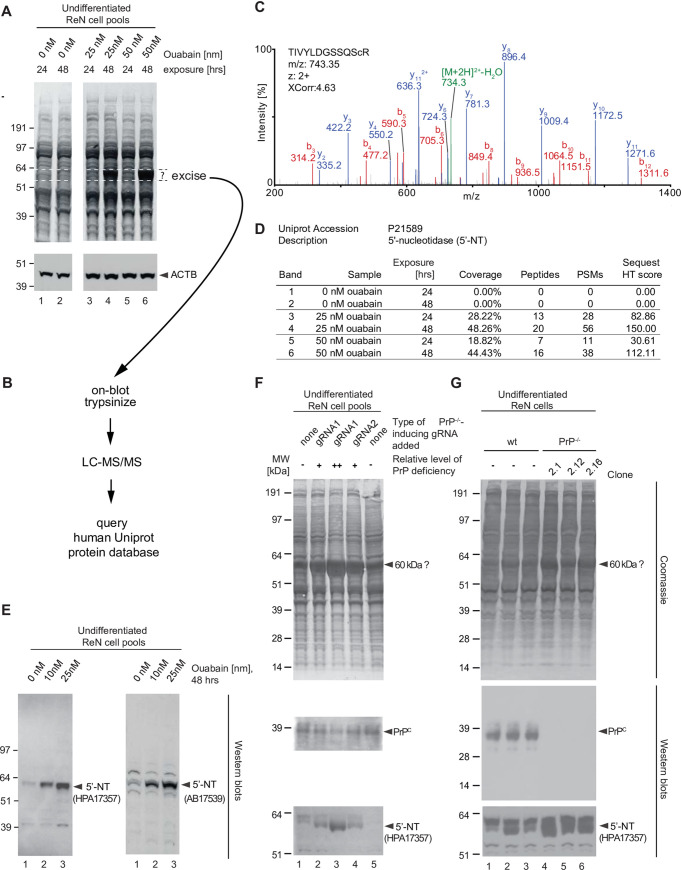
Fig 6. ReN VM cells respond to PrP-deficiency or cardiac glycoside exposure with an increase in the expression of a 60 kDa Coomassie-stained signal, originating from 5’-nucleotidase.
(A) Observation of Coomassie-stained protein band signal at 60 kDa that is conspicuously increased in the presence of 48 hour exposure to ouabain. The blot depicting levels of actin B (ACTB) serves as an additional loading control of samples that had been adjusted for total protein levels. (B) Scheme for the on-blot digestion and mass spectrometry-based identification of the 60 kDa band-of-interest. (C) MS/MS spectrum documenting identification of 5-nucleotidase (5’-NT) as the protein underlying this band. (D) Spectral count comparison of MS-based 5’-NT identification from Western blot bands observed in the absence or presence of ouabain. (E) Western blot validation of changes to 5’-NT expression upon prolonged exposure to low levels of ouabain. (F) CRISPR/Cas9-mediated knockout of PrP mimics low levels of ouabain in its effect on steady-state 5’-NT levels. Initially, the changes in 5’-NT expression were studied in pools of CRISPR-Cas9 gene engineered ReN VM PrP-/- cells generated with two distinct gRNAs. The pools differed in the percentages of cells depleted for PrP expression. Note that the 5’-NT signal levels correlate inversely with the degree of PrP knockout (i.e., the percentage of cells exhibiting the knockout). (G) Analysis of three separate ReN VM-derived PrP-/- clones corroborates changes in 5’-NT expression relative to wild-type Ren VM cells.

