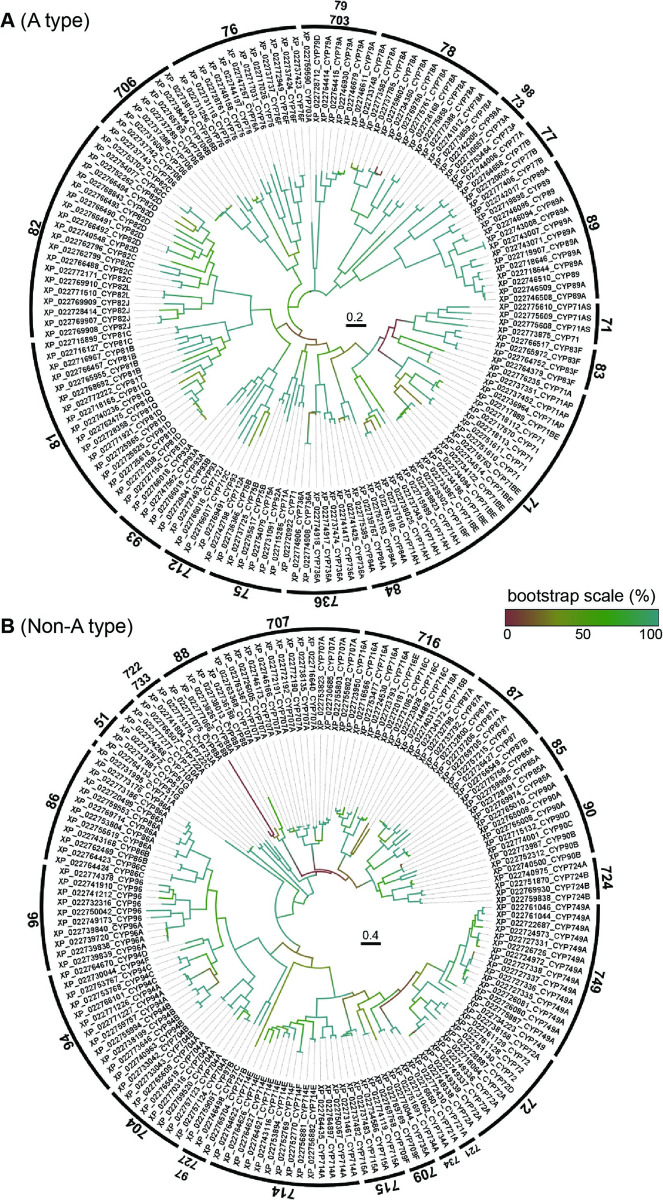
Fig 1. Phylogenic tree of durian cytochrome P450s.
(A) A-type is represented by clan 71. (B) Non-A type is represented by the other families. The numbers on each clan indicate the family of cytochrome P450. The name of durian P450s is indicated by the protein accession number followed by the predicted (sub) family. The tree was constructed by the maximum likelihood method with 100 replicates. The colors on the trees indicate the bootstrap values (percentages) after 100 replicates. The scale bars in the circular trees represent the number of amino acid substitutions per site.

