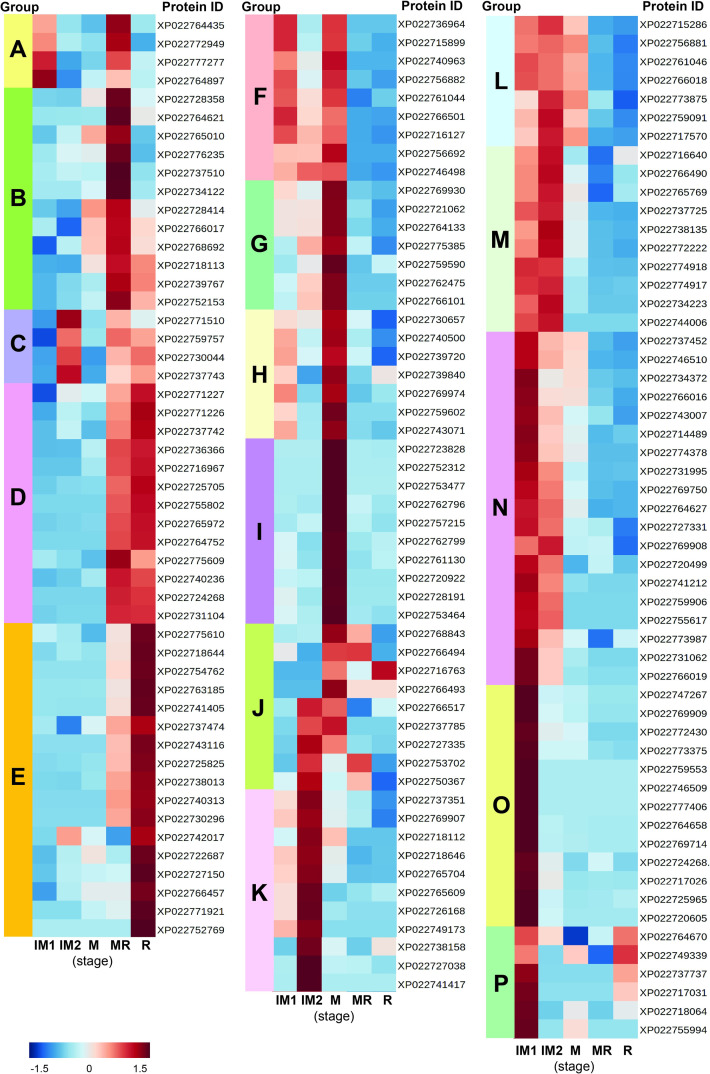
Fig 3. RNA-seq based expression profile of durian P450s during the five stages of the Monthong cultivar.
The P450s were grouped as groups A–P based on a ward clustering algorithm using MetaboAnalyst 5.0, an open-source R-based program. Data were sum normalized, log-transformed, and auto scaled. The color scale indicates the z-score. Stage abbreviations: IM1, immature1; IM2, immature2; M, mature; MR, mid-ripe; R, ripe.

