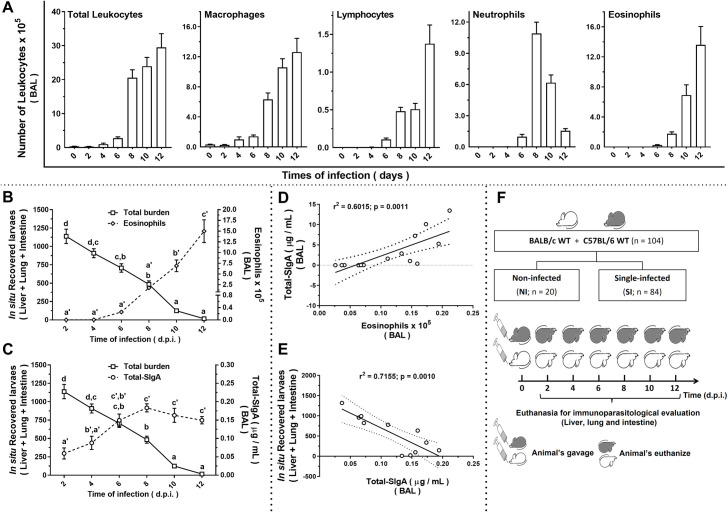
Fig 1. Kinetics of immune response and parasite burden during experimental ascariasis in mice.
Number of leukocytes and their cell subpopulations in bronchoalveolar lavage fluid (BAL) (n = 7) (A). Coincidence curve showing inverse relationship observed between total parasite burden and the number of eosinophils (n = 7) (B) and total SIgA levels (n = 7) (C) in BAL. Scatterplot graphics showing a positive correlation between total SIgA levels and the number of eosinophils from BAL (n = 7) (D) and a negative correlation between total parasite burden and total SIgA levels in BAL (n = 7) (E) on the8th dpi. Schematic representation of experimental design (F). One-way ANOVA followed by Tukey´s multiple comparisons test was used to evaluate differences between groups in (A), and Pearson’s Linear Regression was used to evaluate the correlation in (D) and (E). The letters in (B) and (C) indicate statistically significant difference between mean values, where [a < b < c < d] and [a’ < b’ < c’]. Significant differences between groups (p < 0.05) are represented by the p values in A, D, and E graphs. Data are presented as mean ± SEM.

